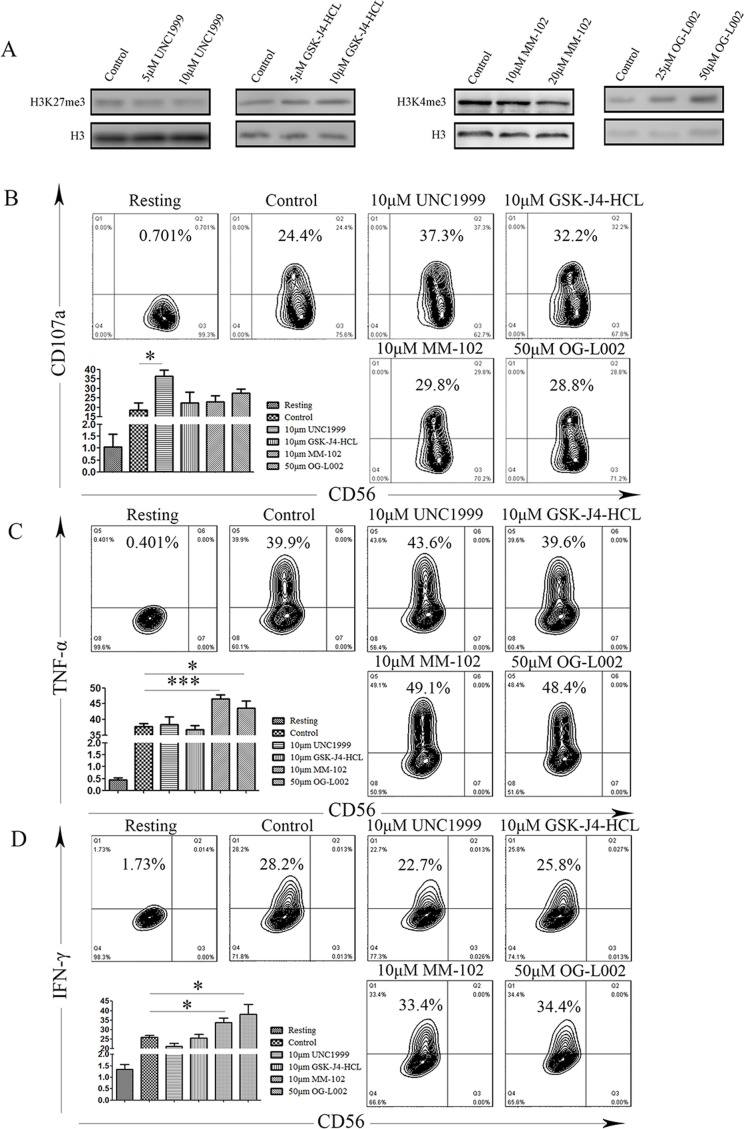
Figure 6. Difference of NK cell degranulation and cytokine production under several chromatin states.
A. Representative western blot of the indicated histone modifications. In NK92MI cells after treatment with DMSO (control), UNC1999, GSK-J4-HCL, MM102 or OG-L002 for 48h (same set-up throughout). B. NK cells were gated on forward scatter/side scatter plots, and the profiles show CD56 versus CD107a mAb staining. Gates indicate the percentage of CD107a positive NK cells. The percentage of CD107a positive is presented as the mean of 3 independent experiments. Bars indicate SD. C. After stimulation, NK92MI cells were surface stained with fluorochrome-conjugated anti-CD56 mAb, fixed, permeabilized, and stained intracellularly with fluorochrome-conjugated mAbs to IFN-γ and TNF-α D.. The percentage of NK cells producing IFN-γ and TNF-α, as indicated, was determined by flow cytometry. Values represent mean mean±SD of at least 3 independent experiments. (*p < 0.05, ***p < 0.01, and two-tailed unpaired t test).

