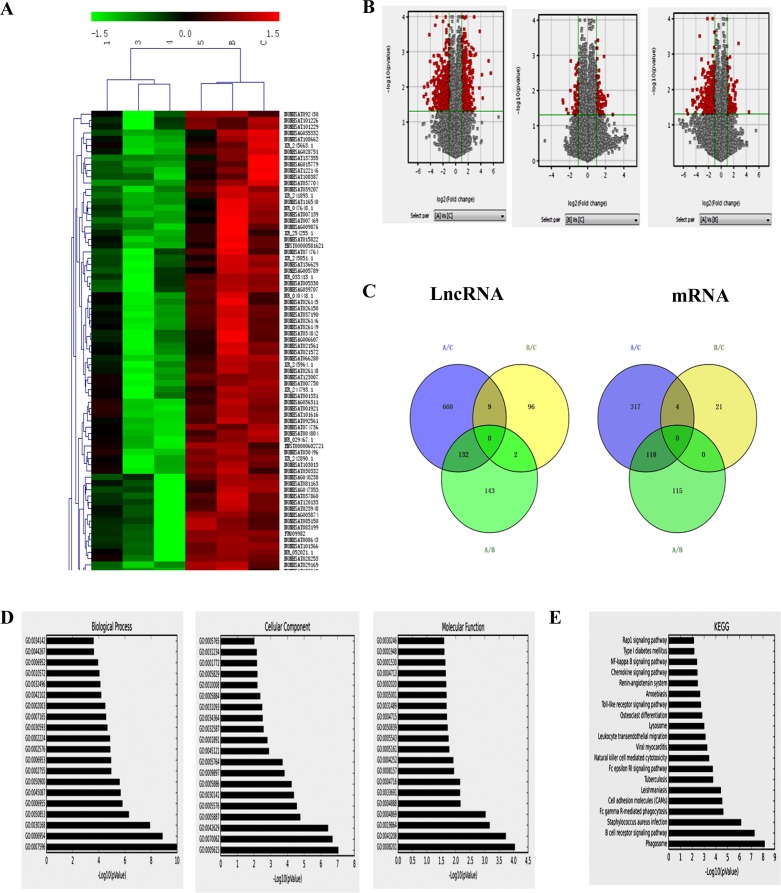
Figure 3. LncRNAs analysis of HPV-related HNSCC.
A. Hierarchical clustering analysis of differentially expressed lncRNAs between HPV-positive HNSCC and HPV-negative HNSCC. Red and green colors indicate high and low expression, respectively. In the heat map, columns represent samples and rows represent each lncRNA. B. Volcano plot of differentially expressed lncRNAs. The vertical lines correspond to 2.0-fold up and down and the horizontal line represents a P value of 0.05. A: HPV-positive group; B: HPV-negative group; C: normal oral mucous group. The gray spot showed fold change<2, P>0.05; and the red spot showed fold change≥2, P≤0.05. C. Venn analysis of the expressed lncRNAs among the control, HPV-positive HNSCC and HPV-negative HNSCC. D. The GO analytical data of aberrantly expressed mRNAs in biological process, cellular component and molecular function between HPV-positive HNSCC and HPV-negative HNSCC. E. The top 20 kinds of pathways among the differentially expressed transcripts between HPV-positive HNSCC and HPV-negative HNSCC by KEGG.

