Figure 5.
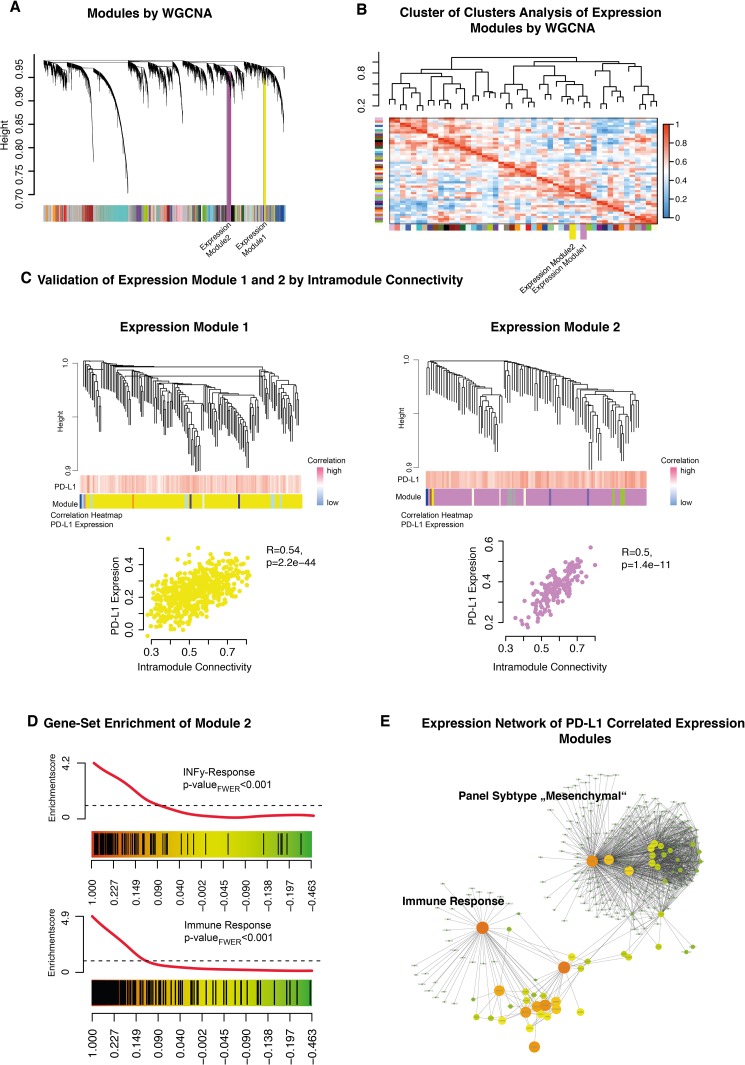
A. Weighted gene co-expression network analysis of the whole transcriptome data. B. A cluster of clusters analysis presented connected expression modules. Expression module 1 and 2 were contained in one cluster. C. Detailed cluster branches of expression module 1 and 2 were illustrated. Corresponding correlation heatmaps of PD-L1 expression and module-contained genes are given in the panel below the branches. Scatterplots of intramodule connectivity (KME) confirmed the strong correlation of PD-L1 expression and the expression modules. D. Gene Set Enrichment Analysis of expression module 1 identified INFγ related genes (upper panel) and immune response (bottom panel). E. Created network analysis of expression module 1/2 based on intramodule connectivity, derived from WGCNA. Size and colours indicate the intensity of intramodule connectivity.

