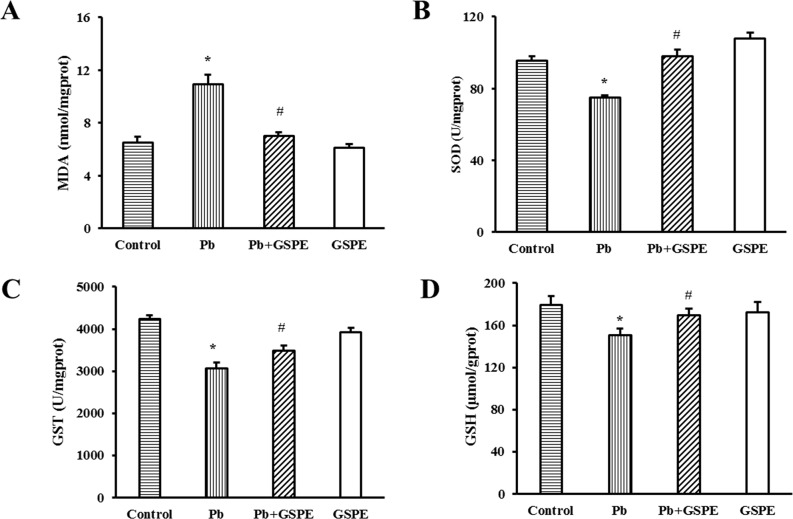
Figure 2. Effects of GSPE on oxidative stress indicators in Pb-treated rat kidneys.
Samples were collected from control, Pb-treated group, Pb + GSPE group, and GSPE. A. The concentration of MDA in the kidney. B. The activity of SOD in the kidney. C. The activity of GST in the kidney. D. The concentration of GSH in the kidney. Data are expressed as mean ± SEM, n = 10. * Significantly different (P < 0.05) from control group, and # significantly different (P < 0.05) from Pb-treated group.

