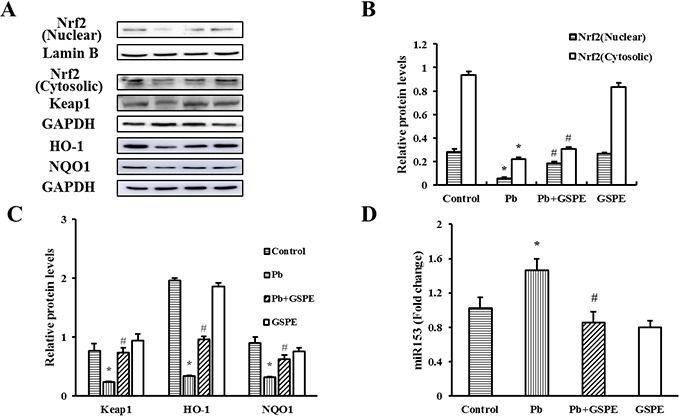
Figure 7. Effects of GSPE on the levels of Nrf2, Keap1, NQO1, HO-1 and miR153 in Pb-treated kidney.

A. The protein levels of Nrf2 (nuclear and cytosolic), Keap1, NQO1, and HO-1. B. The values from densitometry of Nrf2 (nuclear) are normalized to the level of Lamin B protein and expressed as fold increased. B-C. The values from densitometry of Nrf2 (cytosolic), Keap1, NQO1, and HO-1 are normalized to the level of GAPDH protein and expressed as fold increased. D. Quantification of the level of miR153. Data are expressed as mean ± SEM of 4 independent experiments. miRNA expression is shown as fold change with respect to control group. * Significantly different (P < 0.05) from control group, and # significantly different (P < 0.05) from Pb-treated group.
