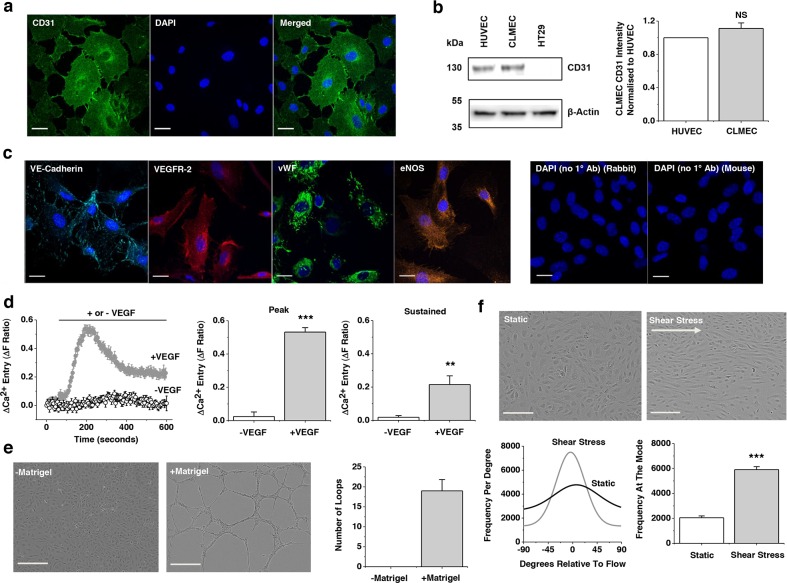
Figure 1. Colorectal cancer liver metastases endothelial cells (CLMECs) are superficially similar to other types of endothelial cells.
a. Immunofluorescence images of CLMECs stained with anti-CD31 antibody (green) and DAPI to label nuclei (blue). Scale bars 20 μm. b. On the left, Western blot labelled with anti-CD31 and anti-β-Actin antibodies for CLMECs, human umbilical vein endothelial cells (HUVECs) and a human colorectal adenocarcinoma cell line (HT29). On the right, quantification of the CD31 band intensity relative to β-Actin and HUVEC (n=3 each). c. Immunofluorescence images of CLMECs stained with anti-VE-Cadherin (turquoise), anti-Vascular Endothelial Growth Factor Receptor 2 (VEGFR-2, red), anti-von Willebrand Factor (vWF, green) and anti-endothelial Nitric Oxide Synthase (eNOS, orange). In each image nuclei were labelled with DAPI (blue). Control images in the absence of the primary antibodies are shown on the right. Scale bars 20 μm. d. Intracellular Ca2+ measurement data from CLMECs. On the left, averaged responses to 30 ng.mL−1 VEGF across multiple wells of a 96-well plate compared to control (N=5 wells each). On the right, mean data for the peak (200 s) and sustained (600 s) responses to VEGF of the type exemplified on the left (n=3, N=15). e. On the left, images of CLMECs in the absence and presence Matrigel®. Scale bars 250 μm. On the right, quantification of the number of complete loops seen in images of the type shown on the left (n=4, N=12). f. Top panels: Images of CLMECs in static condition and after shear stress. Scale bars 80 μm. Bottom left: Example orientation analysis for the images shown at the top. Bottom right: Mean data for the analysis shown on the left (n=3, N=18).

