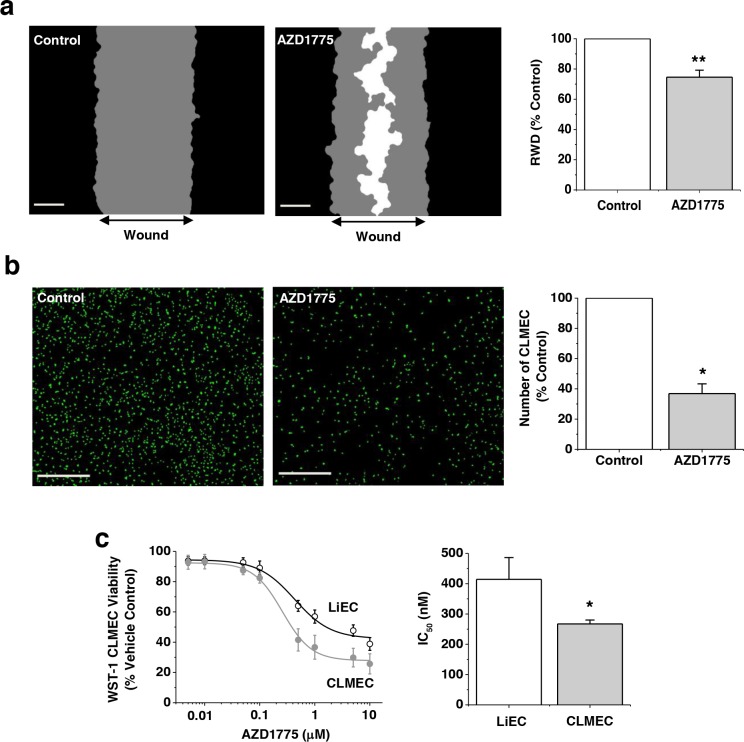
Figure 3. Small-molecule inhibition of WEE1 has preferential effect on CLMECs.
a. On the left, example linear wound mask images after 24 hr CLMEC migration in vehicle control (Control) or 1 μM AZD1775. Black represents cells outside the linear wound (top to bottom), grey - cells which had migrated into the wound, and white - no cells. Scale bars 200 μm. On the right, mean data from images of the type shown on the left. Relative wound density (RWD) in the presence of AZD1775 is presented as a percentage of Control (n=3, N=9). b. On the left, fluorescence images of CLMECs labelled with Vybrant® Dye Cycle™ (green) 48 hr after incubation in vehicle control or 1 μM AZD1775. Scale bars 400 μm. On the right, normalised quantification of the images from independent repeats (n=6, N=18). c. On the left, mean data for CLMEC and LiEC viability measured using WST-1 reagent after treatment with AZD1775 at the indicated concentrations and plotted as percentages of the vehicle control (n=6, N=18 each). On the right, IC50s from the fitted Hill equations shown on the left.

