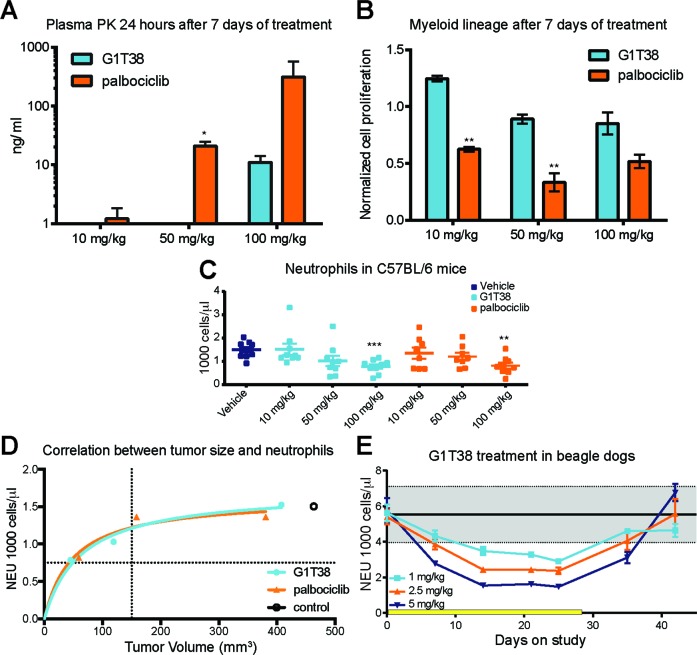
Figure 5. Comparison of myeloid precursor proliferation following G1T38 and palbociclib treatment.
(A) Plasma concentrations of G1T38 or palbociclib 24 hours post 7 days treatment. (B) 12 hours post 7 days of treatment, bone marrow was harvested and proliferation (EdU incorporation) was measured in myeloid progenitors (Mac1+ Gr1+). (C) G1T38 and palbociclib neutrophil counts after 28 days of treatment in C57BL/6 mice. (D) Neutrophil counts and tumor volume in mice after 28 days of palbociclib or G1T38 daily oral treatment as previously described was analyzed using Michaelis-Menten nonlinear regression analysis. Vertical dotted line indicates size of tumor at treatment initiation. Horizontal dotted line indicates level of severe neutropenia in animals (50% of control neutrophil counts). Open circle indicates level of neutrophils and size of tumor after 28 days of daily oral vehicle treatment. (E) Neutrophil counts in beagle dogs during and after 28 days of G1T38 daily oral treatment (n=10; 5 males, 5 females). Yellow bar represents duration of treatment. Error bars represent SEM. *p≤0.05, **p≤0.01, ***p≤0.001.

