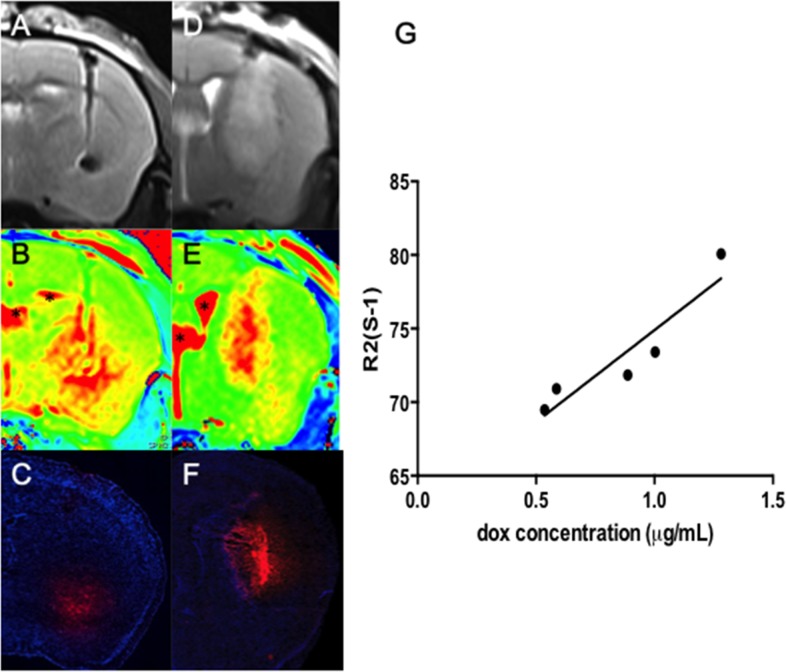
Figure 5. Co-localization of T2 images (A and D) and R2 maps (B and E) with the Dox distribution observed in fluorescence microscopy (C and F) both in normal (A-C) and tumor-implant brain (D-F) (Red: Dox; blue: DAPI for identifying cell nucleus; bar = 1 mm).
Regions mark in “*” indicate the ventricle. (G) Correlation of the ΔR2 level (in s−1) with the CED infused Dox concentration (in μg/mL).

