
Figure 8. Fluorescent microscopic observation of Dox-MB in tumor-implant brain after CED infusion.
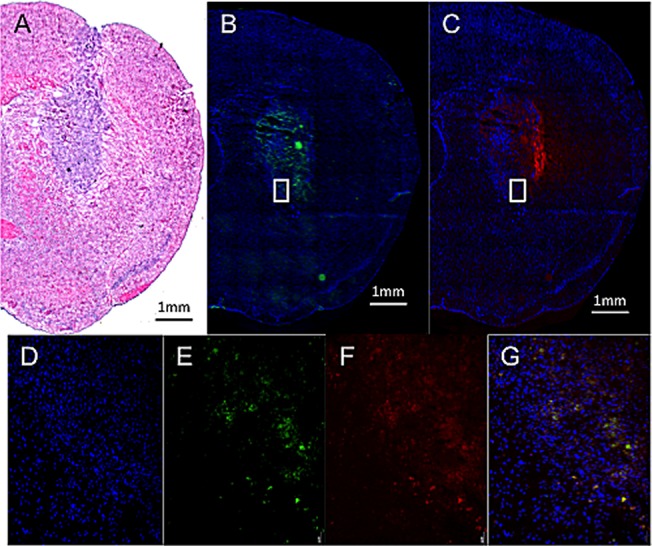
(A) H&E stain showed sizable tumor with hyper-cellularity in putamen. (B, C) Fluorescent microscopy showed the distribution of fluorescent-tagged MB shell (in green), with the distribution similar to the Dox (in red). (D-G) Zoomed picture of the cell nucleus (in blue), fluorescence emitted from MBs (in green), Dox (in red), and co-localization of the three. Bar = 1 mm.