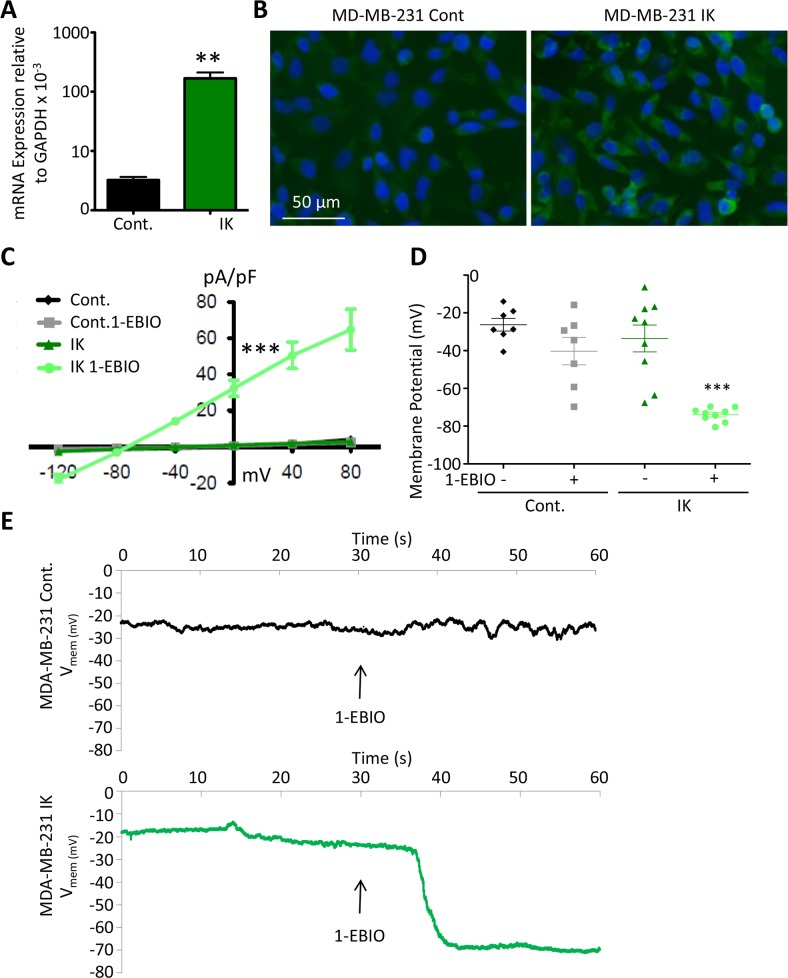
Figure 1. Functional contribution of IK over-expression to current density and Vmem.
(A) IK mRNA expression levels relative to GAPDH in total RNA collected from MDA-MB-231 infected with pMIG-RFP (Cont.) or pMIG-IK (IK) and selected for RFP fluorescence by FACS. Data are presented as mean with standard error of the mean (SEM) of 3 independent replicates (** significant difference p < 0.01, 2 sample t-test). (B) MDA-MB-231 control or MDA-MB-231-IK were fixed on coverslips and immunofluorescence microscopy was performed using antibodies to IK (green) with DAPI (blue) staining of the nuclei. Increased intensity of the green IK staining is evident in the MDA-MB-231-IK sample. (C) Endogenous and 1-EBIO induced current-voltage relationship in control and IK-expressing cells recorded in the cell attached perforated patch configuration from MDA-MB-231 cells. Data are presented as mean ± SEM from a minimum of 7 recordings. The current density was significantly increased in MDA-MB-231-IK 1-EBIO treated cells as compared to control vehicle treated, control 1-EBIO treated, and MDA-MB-231-IK vehicle treated cells (*** p < 0.001, 1-way ANOVA of 0 mV current density) (D) Vmem averaged over 20 seconds from recordings of same cells as C. Data points represent individual cells, bars show mean with SEM (*** indicates significantly different than vehicle treated control p < .001, 1-way ANOVA). (E) Vmem recording of representative MDA-MB-231 control cell (top) and MDA-MB-231-IK cell (bottom) with bath solution exchanged to 1-EBIO solution beginning at 30 seconds and continuing through duration of recording. There is a ~7 second delay between when the solutions are changed and when the new solution reaches the cells.

