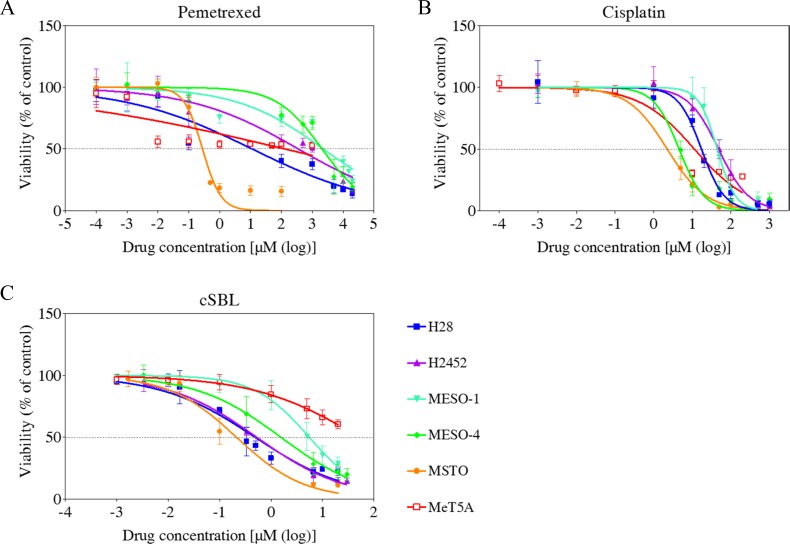
Figure 1.
Dose-response curves in the mesothelioma cell lines (H28, H2452, MESO-1, MESO-4, and MSTO), and MeT5A mesothelial cells treated with pemetrexed (A), cisplatin (B), or cSBL (C). Cells were treated with pemetrexed (0.1 nM–20 mM), cisplatin (1 nM–1 mM), or cSBL (1 nM–30 μM) for 72 h. The dots and bars represent the mean and SD, respectively. Dose-response curves are depicted as lines or dotted lines. Each data point represents the mean ± SD of at least three independent WST-8 assays. Each sample was plated in triplicate.

