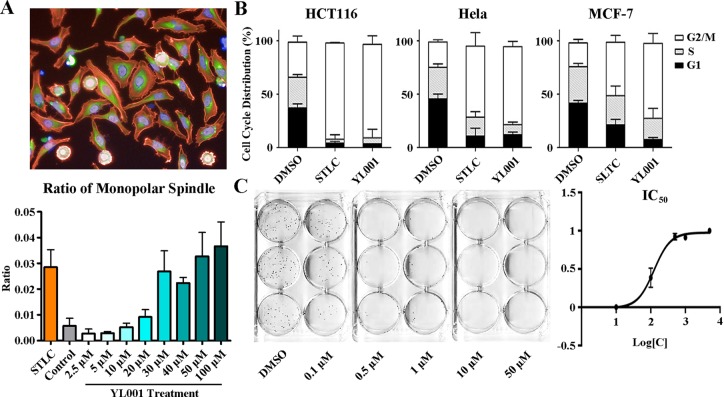
Figure 2. Phenotypic analysis of cells treated with YL001.
(A) HeLa cells were treated with 50 μM YL001 or STLC (control) for 8 hours and fixed and stained for high content screening. Actin (red staining); tubulin (green staining); DNA (blue staining). The bar graph below shows the ratio of monopolar spindle cells to all cells treated with YL001 at different concentrations. (B) Cell cycle analysis of cells treated with YL001 in various cancer cell lines. YL001 efficiently arrested cells in mitosis and caused cell death. (C) HeLa cells were treated with gradient concentrations of YL001. The graph to the right shows inhibition with different treatment. YL001 exhibited antitumor activity by suppressing tumor growth in the colony formation assay.

