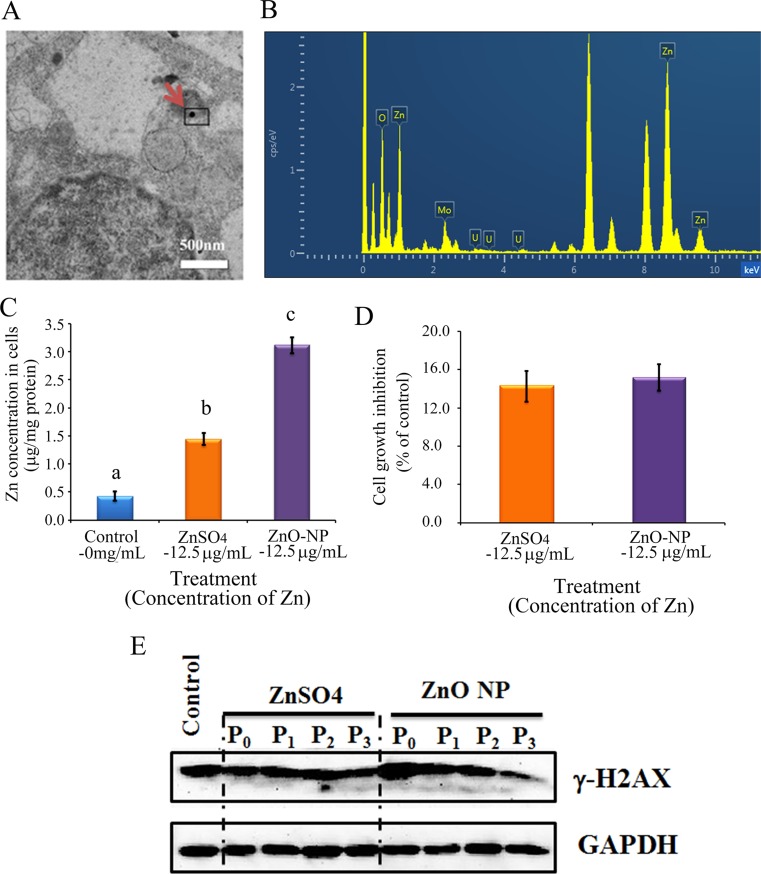
Figure 3. ZnO NPs in CHO-K1 cells and the impacts on cell growth and γ-H2AX.
(A) TEM photo of ZnO NPs in CHO-K1 cells indicated by the red arrow; (B) EDS image of ZnO NPs in CHO-K1 cells, three Zn peaks shown; (C) Concentration of Zn in ZnO NPs or ZnSO4 treated CHO-K1, a,b,c, same letter means no difference, different letters mean the groups have difference, p < 0.05; (D) Effects of ZnO NP and ZnSO4 on CHO-K1 cell growth; (E) Alteration of γ-H2AX by ZnO NPs using WB analysis; N ≥ 3.

