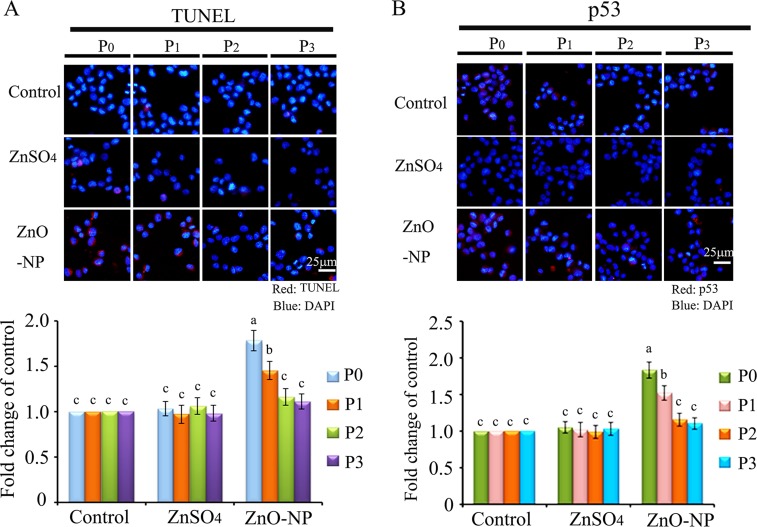
Figure 5. IHF images for TUNEL assay and p53 levels in ZnO NPs treated CHO-K1 cells.
(A) Increase in the TUNEL positive cells in P0 and P1 cells by ZnO NPs treatment. Red: TUNEL staining; Blue: DAPI staining for nucleus; (B) Elevation of the protein levels of p53 in P0 and P1 cells by ZnO NPs treatment. Red: p53 staining; Blue: DAPI staining for nucleus. Scale bar: 25 μm; N ≥ 3. a-c Means not sharing a common superscript are different.

