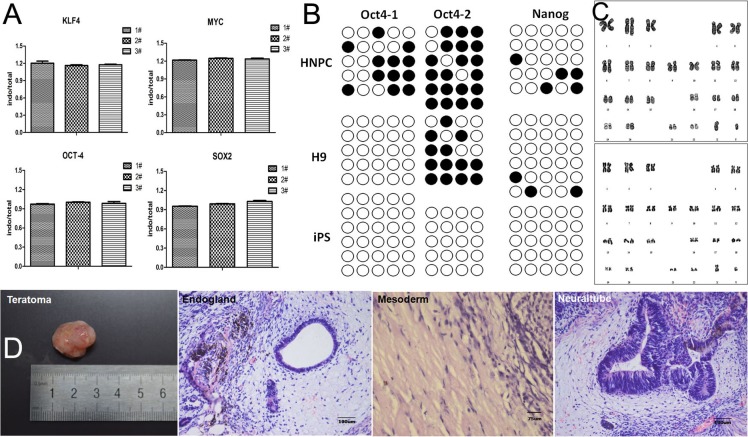
Figure 2. Characterization of iPS colonies generated from NPCs.
(A) Real time polymerase chain reaction (RT-PCR) analysis of endogenous and total genes in induced colonies. 1# and 2# represent NPC-derived iPSCs P4 and P16, 3# represent H9 P38. (B) DNA methylation analysis in the promoters of Oct4 and Nanog by bisulfite sequencing. Human NP and H9 cells were used as controls. (C) Karyotyping analysis of a representative colony. (D) Hematoxylin and eosin (HE) staining of teratomas derived from NP-derived iPSCs.

