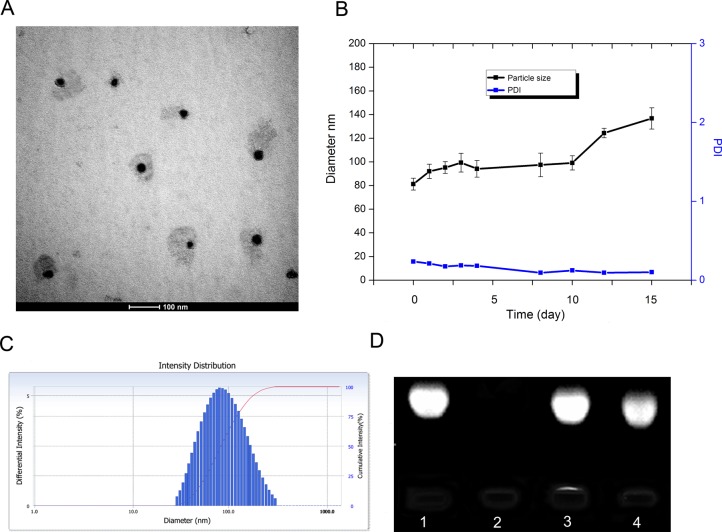
Figure 2. Characteristics of LNPS@siBcl-2.
(Panel A) is TEM images of LNPS@siBcl-2. (Panel B) is the stability of LNPS@siBcl-2 in PBS pH7.4 solution. (Panel C) is particle size distribution of LNPS@siBcl-2. (Panel D) is the stability of siBcl-2 in LNPS@siBcl-2 against RNase A digestion, following incubation at 37°C for 3 h. Lane 1: free siBcl-2, lane 2: free siBcl-2+RNase A, lane 3: LNPS@siBcl-2, lane 4: LNPS@siBcl-2+RNase A. Data are expressed as the mean ± SD (n = 3).

