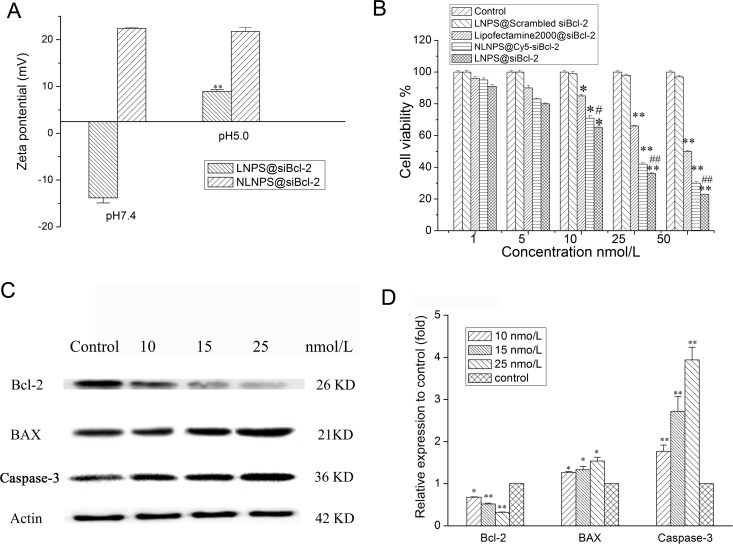
Figure 3.
Effect of the medium pH on the zeta potential of LNPS@siBcl-2 (panel A), and gene silencing effect of LNPS@siBcl-2 on A549 cells. (Panel B) is the cytotoxicity of LNPS@siBcl-2 on A549 cells. (Panel C) is the Western Blot analysis of Bcl-2, BAX and Caspase-3 on A549 cells. (Panel D) is the statistic result of protein expression. Data are expressed as the mean ± SD, n = 3. *p < 0.05, **p < 0.01, vs control, #p < 0.05, vs Lipofactemine2000@siBcl-2.

