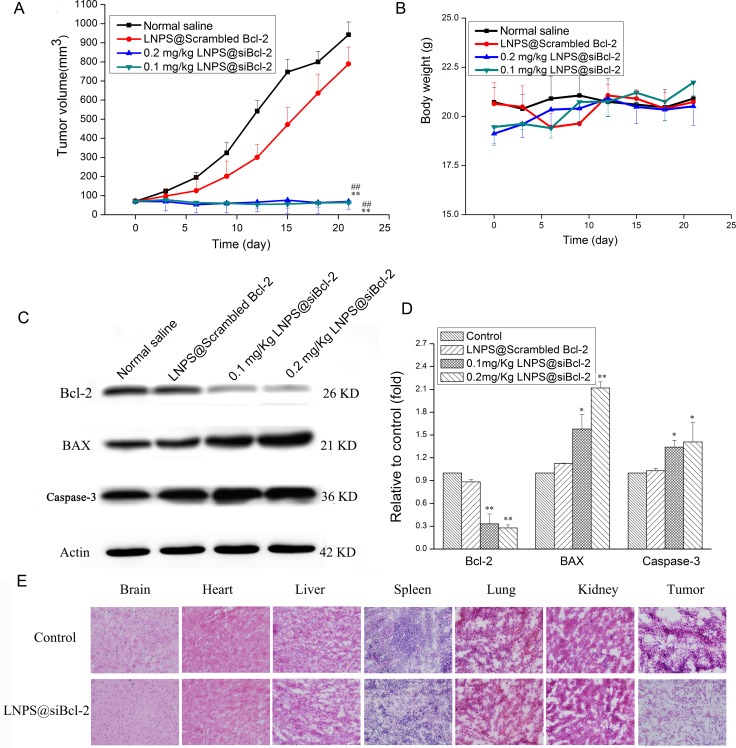
Figure 8. The in vivo antitumor activity of LNPS@siBcl-2 on tumor-bearing nude mice.
(Panel A) is the change in tumor volume. (Panel B) is the body weight change during treatment. (Panel C) is the Bcl-2, BAX and Caspase-3 expression in tumor tissue after tumor-bearing mice were treated with LNPS@Cy5-siBcl-2. (Panel D) is the statistic result of panel C. (Panel E) is representative H&E staining picture of major organs and tumor tissue. Data are expressed as the mean ± SD, n = 5. **P < 0.01, vs Normal Saline. ##P < 0.01, vs LNPS@Scrambled Bcl-2.

