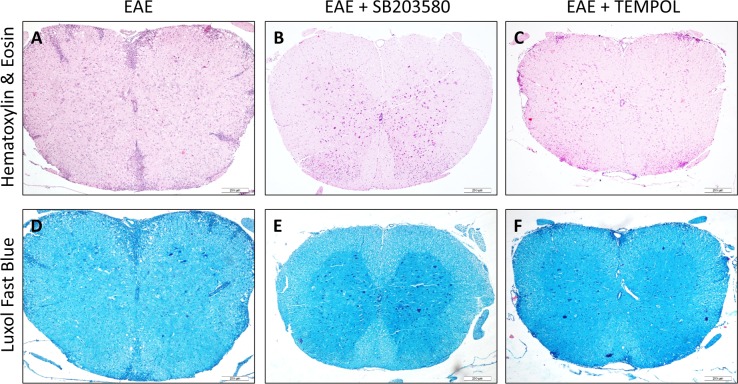
Figure 2. Each of the two treatments inhibits the development and progression of EAE in mice.
(A-C) Comparison of HE staining in different groups. There were obvious reduced numbers of inflammatory infiltrates in the spinal cords of the intervention groups of mice. (D-F) Comparison of LFB staining in different groups. The degree of demyelination in the intervention groups of mice was significantly lower than that in the EAE mice. Data shown are representative images from each group or expressed as the mean ± SD of each group (n = 6). A,D: EAE, B,E: SB203580, C,F: TEMPOL. Scale bar = 200 μm.

