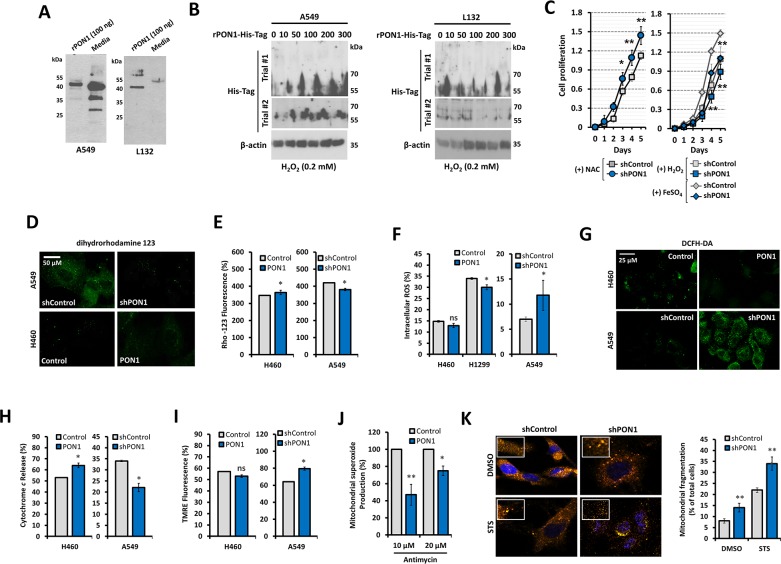
Figure 4. PON1 regulation positively impacts lung cancer by antioxidative function-controlled ROS accumulation.
(A) PON1 immunoblot of A549 (left panel) and L132 (right panel) cells after loading with 100 ng of human rPON1 protein for 24 h. (B) Detection of human rPON1-His-tag protein using His-tag antibody in A549 cells (left panel) and L132 cells (right panel) under oxidative stress induced by H2O2 for 24 h. (C) Assessment of cell viability after treatment with NAC, H2O2, or FeSO4. (D) Representative images showing fluorescence signal after loading with dihydrorhodamine 123. Scale bars = 50 μm. (E, F, G, H, I) Cells were analyzed by FACS for the following: ROS determination (both rhodamine and DCFH fluorescence intensity units), dihydrorhodamine oxidation fluorescence, cyctochrome c release, and mitochondrial membrane. FACS-analyzed cells were 400-1000 in population. In G, representative images showing fluorescence signal after loading with DCFH-DA. Scale bars = 25 μm. (J) FACS analysis of cells loaded with Mito-HE (2 μM), treated with antimycin A (10 and 20 μM). (K) Mitchondrial fragmentation determined by MitoSOX (pseudocolored in orange; 10 μM) after loading cells with either 0.01% DMSO or 1 μM STS and quantification of fragmented cells. Bar graphs mean ± S.E.M. of total fragmented cells. All experiments were conducted at least in triplicate and biologically repeated at least twice. Statistical analysis was performed using unpaired Student's t test and ANOVA. Symbols represent mean ± S.E.M. n = 3~7; n.s., not significant; *P<0.05; **P<0.01.

