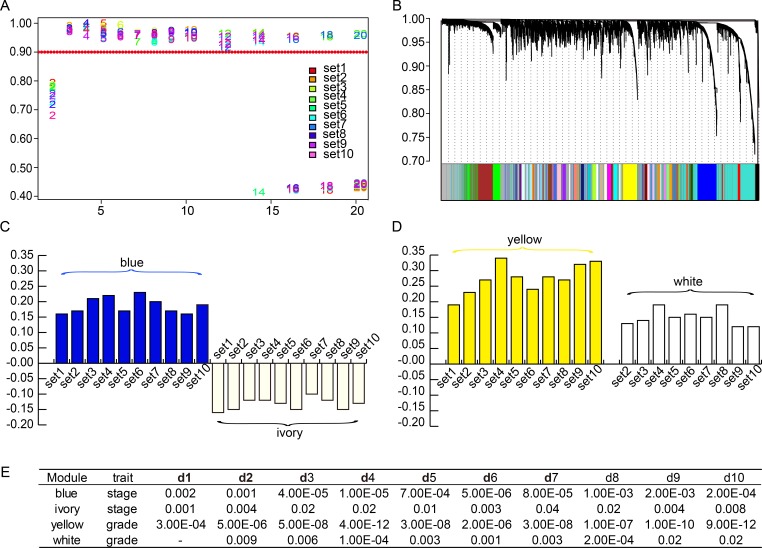
Figure 1. Weighted gene co-expression network of SOC.
(A) Network topology analysis was employed to choose a soft-thresholding power to achieve scale-free topology in all modeling sets. (B) Fifty-four significant co-expression gene modules shared in ten random sampling sets were detected with WGCNA. Consensus gene dendrogram and module colors denote correspondence. (C) Correlation values of blue and ivory module-trait relationships across ten random sampling datasets. (D) Correlation values of yellow and white module-trait relationships across ten random sampling datasets. (E) P values of module-trait relationships of two stage-associated and two grade-associated modules across ten random sampling datasets (p < 0.05).

