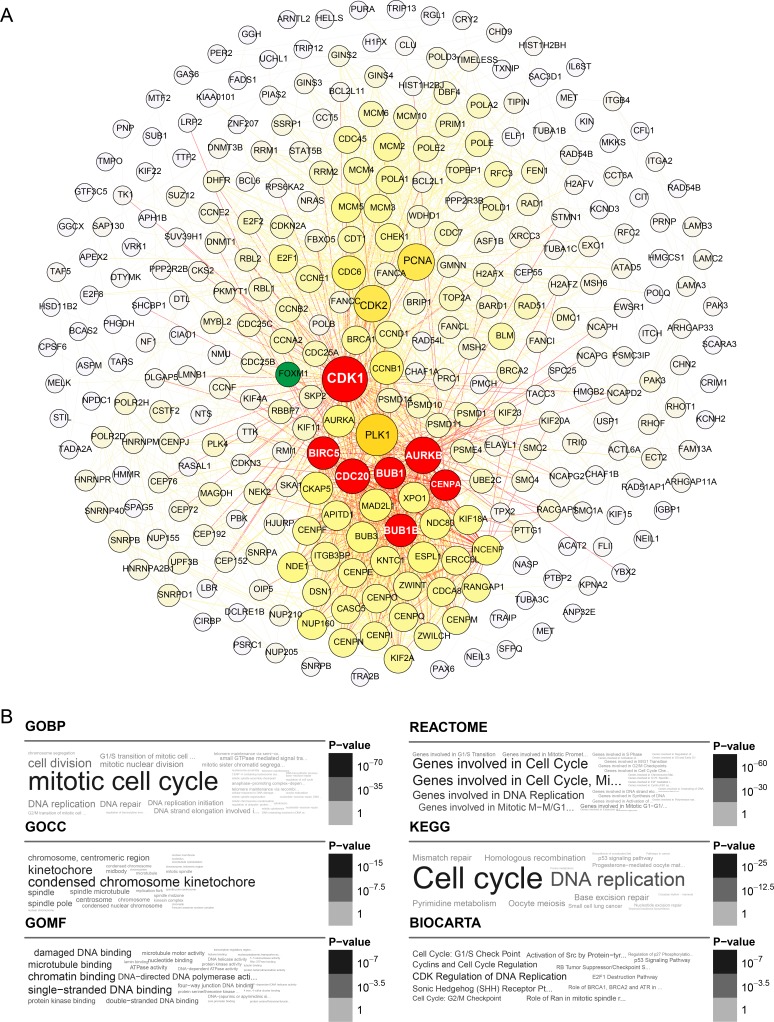
Figure 3. Yellow module gene network and enrichment analysis.
(A) Top hub genes of the yellow module are shown in yellow; gene importance was assigned according to circle diameter and color depth, in descending order. Intersection of the top 25 hub genes with the high-quality STRING network is shown in red. FOXM1 is shown in green as a node connected to CDK1 and CENPA. (B) Gene ontology and pathway enrichment analysis of yellow module genes.

