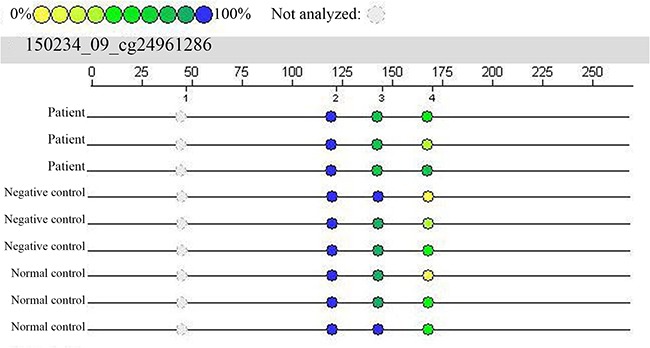
Figure 1. Results from mass spectral analysis of the Smad3 gene (cg24961286).

In this experiment, 4 CpG loci were investigated, and 3 of these loci were captured. In the patient group, CpG_3 is lighter in color, indicating hypomethylation, whereas in the negative and normal control groups, this locus appears darker in color, indicating relatively high methylation.
