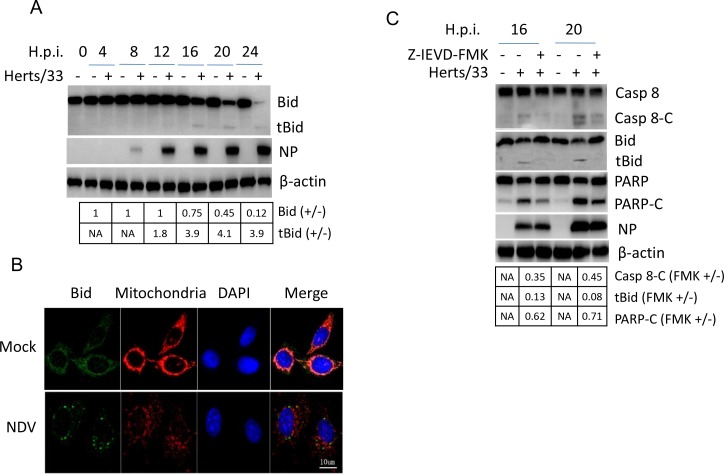
Figure 3. Bid is cleaved by caspase 8 and promotes apoptosis during NDV infection.
(A) The cleavage of Bid during NDV infection. Cells samples in Figure 1A were analyzed with Western blot using indicated antibodies. The intensities of Bid and tBid bands were determined by densitometry, normalized to β-actin, and shown as fold change (virus:mock). (B) The subcellular distribution of Bid during NDV infection. HeLa cells were mock-infected or NDV-infected. Cells were harvested at 16 h.p.i. and the subcellular distribution of Bid (green) and mitochondria (red) were analyzed with immunostaining. Nuclei were stained with DAPI (blue). Images were acquired with a META 510 confocal laser-scanning microscope (Zeiss). Merged images illustrate DAPI/Bid/mitochondrial tracker fluorescence. (C) Bid cleavage and PARP cleavage are dependent on caspase 8 activity. HeLa cells were mock-infected or infected with NDV, followed by the treatment of DMSO or 40 uM caspase 8 inhibitor Z-IEVD-FMK. Cells were harvested at 20, and 24 h.p.i., and the cleavage of caspase 8, Bid, and PARP were analyzed with Western blot. The intensities of bands were determined by densitometry, normalized to β-actin, and shown as fold change (FMK+/−).

