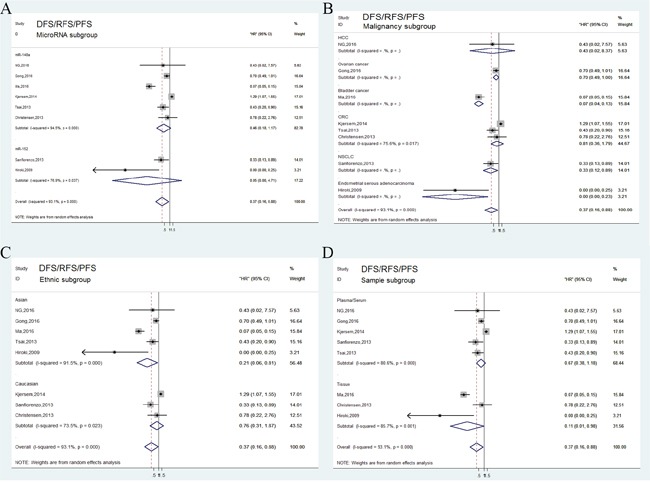
Figure 4. Forest plots of subgroup analysis of the DFS/RFS/PFS.

(A) stratified by MicroRNA subgroup; (B) stratified by malignancy subgroup; (C) stratified by ethnic subgroup; (D) stratified by sample subgroup.

(A) stratified by MicroRNA subgroup; (B) stratified by malignancy subgroup; (C) stratified by ethnic subgroup; (D) stratified by sample subgroup.