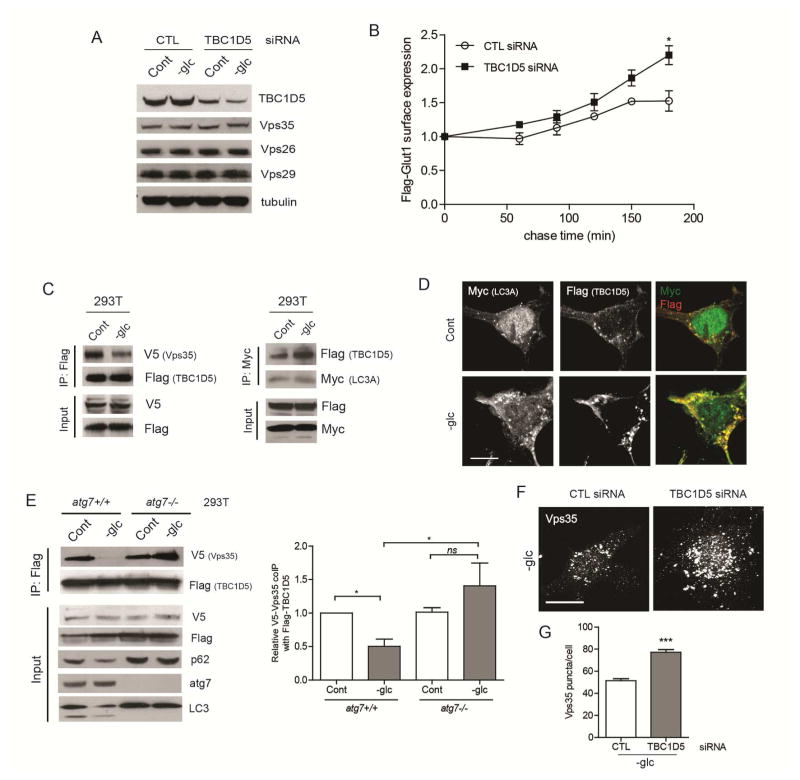
Figure 5. Autophagy-dependent shuttling of TBC1D5 from the retromer to LC3+ compartments controls Glut1 trafficking.
(A) atg5−/− MEFs were transfected with siRNAs against non-targeting control (CTL) and TBC1D5, glucose starved for 18h and lysates were immunoblotted for TBC1D5 and retromer subunits. (B) atg5−/− MEFs were first transfected with CTL or TBC1D5 siRNAs, and subsequently transfected with Flag-Glut1 24h later. Kinetics of Flag-Glut1 recycling over indicated times measured by flow cytometry (mean ± SEM, n=3). P values calculated using unpaired t-test. (C) HEK293T cells were transiently transfected with Flag-TBC1D5, V5-Vps35 and Myc-LC3A. Cells were glucose starved for 8h. Lysates were immunoprecipitated with α-Flag (left) or α-Myc (right), resolved on SDS-PAGE and immunoblotted as indicated. (D) HEK293T cells transiently overexpressing Myc-LC3A and Flag-TBC1D5 were glucose starved for 6h and immunostained with α-Flag and α-Myc. Scale bar, 10μm. (E) HEK293T cells with or without ATG7 deletion were transiently transfected with Flag-TBC1D5 and V5-Vps35; cells were glucose starved and lysates were immunoprecipitated with α-Flag and immunoblotted as indicated. Right: Quantification of co-immunoprecipitated V5-Vps35 (mean±SEM, n=3 independent experiments). P values calculated using ANOVA followed by Tukey’s HSD test. (F) atg5−/− MEFs were transfected with CTL or TBC1D5 siRNAs, glucose starved for 18h and immunostained for Vps35. Scale bar, 25 μm. (G) Quantification of the number of Vps35 puncta per cell (n=60 cells from 3 independent experiments). P values calculated using unpaired t-test. ***P<0.001, *P<0.05; ns, not significant. Related to Figure S4.

