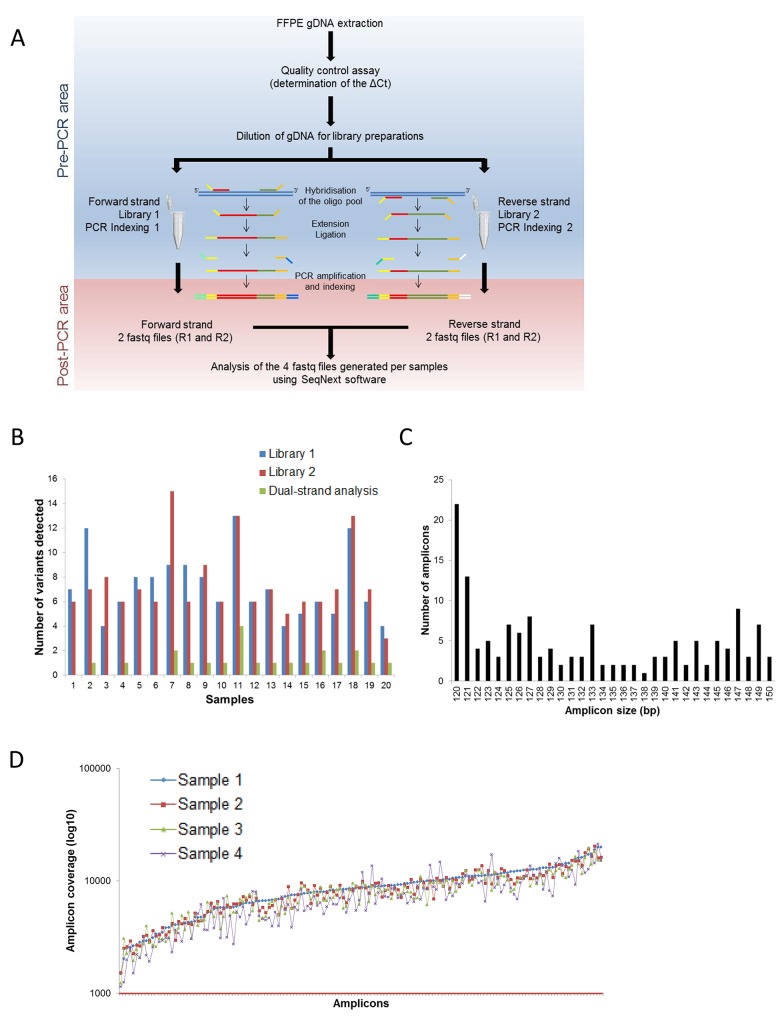
Figure 1. Process workflow and specifications of the DSTP.
A. Description of the DSTP library preparation workflow. B. Interest of the dual-strand library preparation to detect mutations. Number of mutations detected using the information from Library 1 only (blue histogram), Library 2 only (red histogram) or from both libraries (green histogram). C. Amplicon size distribution for the 150 amplicons of the panel. D. Coverage distribution plot of 4 representative samples sequenced in a run with 32 samples pooled on a v2 standard flow cell. The Red line represents the targeted depth (1000×).

