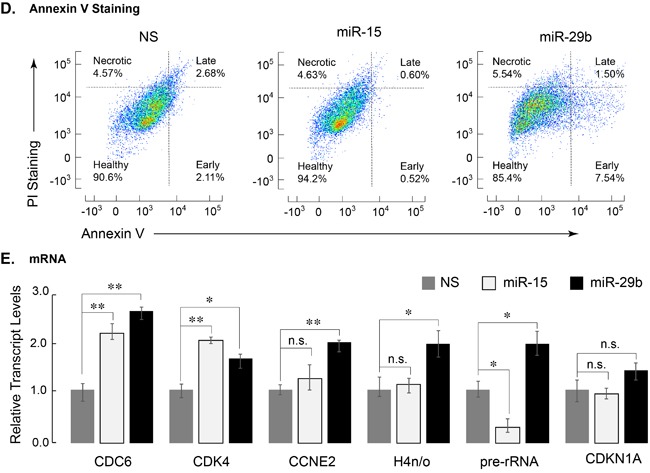
Figure 3. Leukemia cells expressing miR-29b-1 exhibit decreased cell growth/metabolic health, increased apoptosis, and modified expression of cell cycle related genes.

A. SKNO-1 cells expressing indicated miRs were analyzed for NADPH activity. Two independent biological replicates show that miR-29b-1 (black bar) adversely affects metabolic health of SKNO-1 cells when compared to NS control (gray bar) or miR-15 (white bar) (n = 4; p > 0.01). B. Equal number of SKNO-1 cells (2.5 × 10⁵), infected with NS (gray triangle), miR-15 (open square), and miR-29b (closed circle) were plated in triplicate wells in 12-well plates, and counted for live cells each day for 5 days using the trypan blue dye. Line graphs represent two independent experiments. C. SKNO-1 cells infected with NS (gray), miR-15 (blue), and miR-29b (red) were stained with propidium iodide and analyzed for cell cycle profile. Arrow indicates accumulation of sub-G1 population in miR-29b-infected cells. D. Infected SKNO-1 cells were examined for apoptosis by AnnexinV-Cy5 staining. Cells were counterstained with propidium iodide (PI). Scatter plots of analyzed data are shown and percent of cells in each of the four quadrants indicating healthy, early apoptotic, late apoptotic and necrotic cells is shown. E. Expression of cell cycle related genes was determined by qPCR of total cellular RNA from SKNO-1 cells infected with NS (gray bars), miR-15 (white bars) and miR-29b (black bars). Bar graphs represent data from three independent experiments; expression of each gene is normalized to that of HPRT. Error bars indicate standard deviation (n = 6), and the asterisks show significance i.e., * = p < 0.05, ** = p < 0.01, n.s. = not significant.
