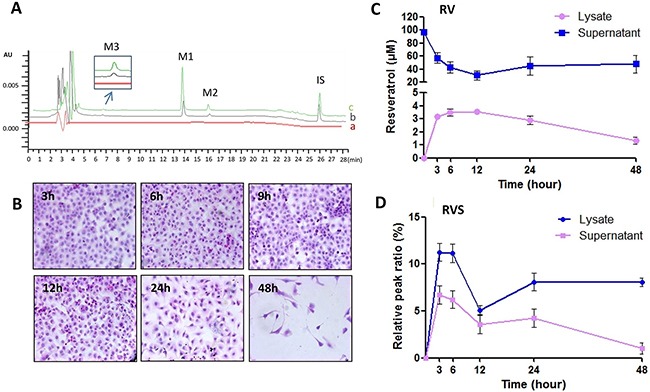
Figure 3. RV metabolic pattern in HBC T24 cells.

A. Representative HPLC/DAD analysis of resveratrol in T24 cells. (a) HBC T24 cells treated without RV as Control; (b, c) T24 cells treated with 100μM resveratrol for 48h, cell supernatant (b) and cell lysates (c) spiked with 1,8-dihydroxy anthraquinone (internal standard, IS). Peaks: M1. trans-resveratrol, tR=13.82min; M2. cis-resveratrol, tR=15.97min; M3. resveratrol monosulfate (RVS), tR=6.67min; IS. 1,8-dihydroxy anthraquinone, tR=25.93min (Internal standard/IS). B. Morphologic changes were evaluated by HE staining (100×), and T24 cells showed neither observable growth arrest nor morphological change until 24h resveratrol incubation. C & D. Quantification of RV and RVS in T24 cells. Resveratrol concentrations in the cell lysates and supernatant after 100μM resveratrol treatment for 3, 6, 12, 24 and 48h, respectively.
