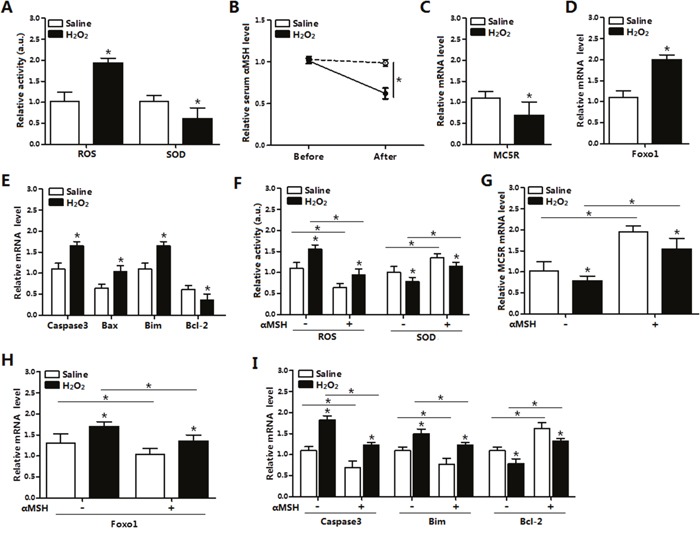
Figure 1. αMSH inhibited H2O2-induced oxidative stress, Foxo1 expression and apoptosis in mice adipose tissue.

(A) Serum activity of ROS and SOD of mice with intraperitoneal injection of H2O2 (300 mg/kg/day) for 5 days or with saline injection (n=6). (B) Serum αMSH level before and after injection in both groups (n=6). (C) Relative mRNA levels of MC5R in the H2O2 and Control group (n=6). (D) Relative mRNA levels of Foxo1 in the H2O2 and Control group (n=6). (E) Relative mRNA levels of Caspase3, Bax, Bim and Bcl-2 in the H2O2 and Control groups (n=6). (F) Serum activity of ROS and SOD of mice with injection of αMSH, after injection of H2O2 or saline for 5 days (n=6). (G) Relative MC5R mRNA levels with injection of αMSH, after injection of H2O2 or saline for 5 days (n=6). (H) Relative Foxo1 mRNA levels with injection of αMSH, after injection of H2O2 or saline for 5 days (n=6). (I) Relative Caspase3, Bim, Bcl-2 mRNA levels with injection of αMSH, after injection of H2O2 or saline for 5 days (n=6). Values are means ± SD. vs. Control group, *p < 0.05.
