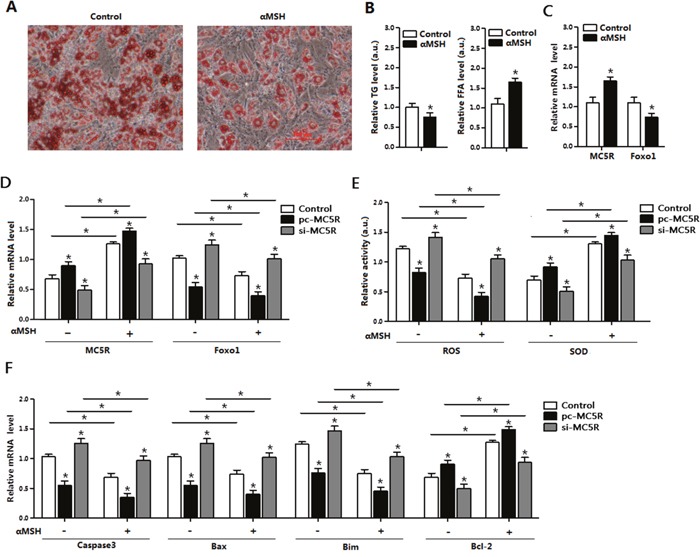
Figure 3. αMSH and MC5R inhibited oxidative stress, apoptosis and Foxo1 expression in mice adipocytes.

(A) Images of adipocytes stained by Oil Red O staining after treatment of αMSH on differentiation until 6 day (n=6). (B) Relative TG level and FFA level after treatment of αMSH on differentiation until 6 day (n=6). (C) Relative mRNA levels of MC5R and Foxo1 in the control group and αMSH treatment group (n=6). (D) The mRNA expression of MC5R and Foxo1 after transfection with control vector, pc-MC5R and si-MC5R (n=6). (E) The relative activity of ROS and SOD after transfection with control vector, pc-MC5R and si-MC5R (n=6). (F) The mRNA expression of Caspase3, Bax, Bim, and Bcl-2 after transfection with control vector, pc-MC5R and si-MC5R (n=6). pc-MC5R: MC5R overexpression vector; si-MC5R: MC5R shRNA vector; Control: pcDNA 3.1 vector. Values are means ± SD. vs. Control group, *p < 0.05.
