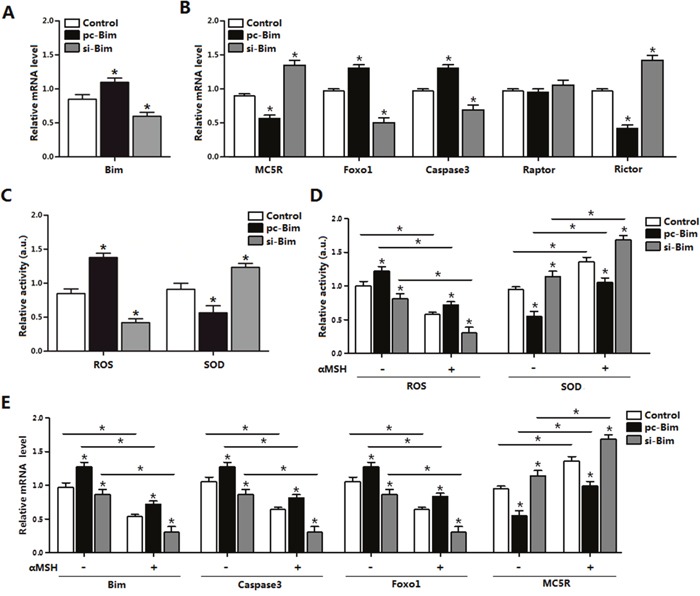
Figure 6. αMSH inhibited apoptosis through reducing Bim and Foxo1 expression.

(A) Bim transfection efficiency detection in Control group, pc-Bim group and sh-Bim group after 48 h transfection (n=3). (B) Relative mRNA level of MC5R, Foxo1, Caspase3, Raptor and Rictor in Control group, pc-Bim group and sh-Bim group after 48h transfection (n=3). (C) Relative activity of ROS and SOD in Control group, pc-Bim group and sh-Bim group after 48 h transfection (n=3). (D) Relative activities of ROS and SOD in Control group, pc-Bim group and sh-Bim group after 48 h transfection under treatment of αMSH (n=3). (E) Relative mRNA levels of Bim, Caspase3, Foxo1 and MC5R in Control group, pc-Bim group and sh-Bim group after 48 h transfection under treatment of αMSH (n=3). pc-Bim: Bim overexpression vector; si-Bim: Bim shRNA vector; Control: pcDNA 3.1 vector. Values are means ± SD. vs. Control group, *p < 0.05.
