
Figure 13. HCC cell proliferation in the presence of autophagy inducer, Torin 1 and autophagy inhibitor, HCQ.
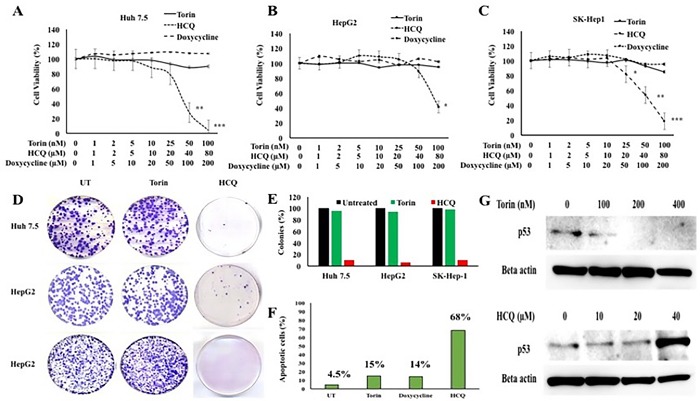
Three different HCC cell lines (Huh-7.5, HepG2 and SK-Hep-1) were seeded in 24 well tissue culture plates and then treated with increasing concentrations of either Torin 1 or HCQ. MTT assay was performed after 72 hours. A. Proliferation of Huh7.5 cells in the presence of Torin 1 or HCQ. B. Proliferation of HepG2 cells in the presence of Torin 1 and HCQ. C. Proliferation of SK-Hep-1 in the presence of Torin 1 and HCQ. D. Cell colony assay showing the long-term proliferation of three HCC cell lines treated with autophagy inducer (Torin1) or lysosomal inhibitor (HCQ). E. Quantitation of cell colonies that survived drug treatment. F. Huh-7.5 cells were seeded at 1×10⁵ per ml in 6 well tissue culture dish. The next day, cells were treated with Torin (100nM), HCQ (80μM) or doxycycline (200μM) for 48 hours. After this step, cells were isolated by trypsin-EDTA and washed with PBS then incubated with indicated concentartions of FITC-annexin V and propodium iodide (PI) (BD Biosciences) in binding buffer for 15 minutes in dark. Stained cells were immediately subjected to flow cytometry analysis using FACS Calibur flow cytometer (BD Biosciences, San Diego, CA). Flow cytometric evaluation of apoptosis after treatment with Torin 1, or HCQ or Doxycycline. G. Western blot shows the expression of p53 tumor suppressor in Huh7.5 cells treated with increasing concentration of autophagy inducer Torin 1 and autophagy inhibitor HCQ.