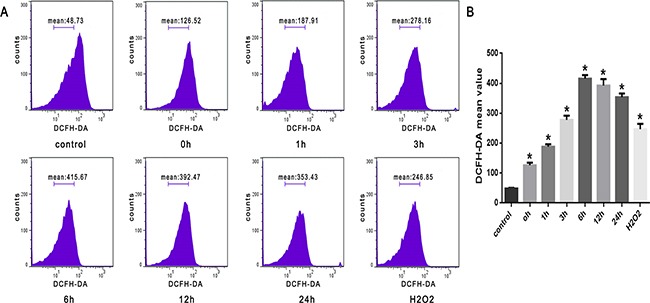
Figure 2. ROS increased after heat stress in SW480 cells.

SW480 cells underwent intense heat stress (43°C) for 2h, and were further incubated at 37°C for different times as indicated (0h, 1h, 3h, 6h, 12h or 24h). Cells were labeled with 10 μM DCFH-DA for detection of ROS. H2O2 was used as a positive control. A. Flow cytometry analysis of heat stress-induced ROS. B. The histogram represents quantified ROS generation after heat stress analyzed by flow cytometry. The data shown represent the mean ±SD of at least three independent experiments, performed in duplicate. *P < 0.05, statistically significant relative to control (37°C).
