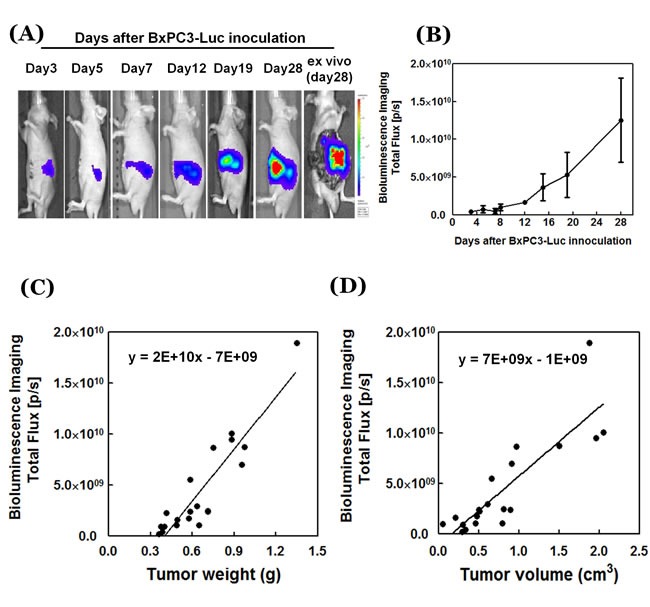
Figure 3.

A. In vivo luciferase images of growing orthotopic pancreatic tumors (IVIS Spectrum) (see Figure D). B. Quantitative imaging data of pancreatic-cancer growth are presented as mean ± SD. C. Correlation between tumor weight photon flux and D. tumor volume photon flux. Please see Materials and Methods for details. Data (n = 20) are presented as linear regression and Pearson correlation by GraphPad Prism. P/S= photon/second.
