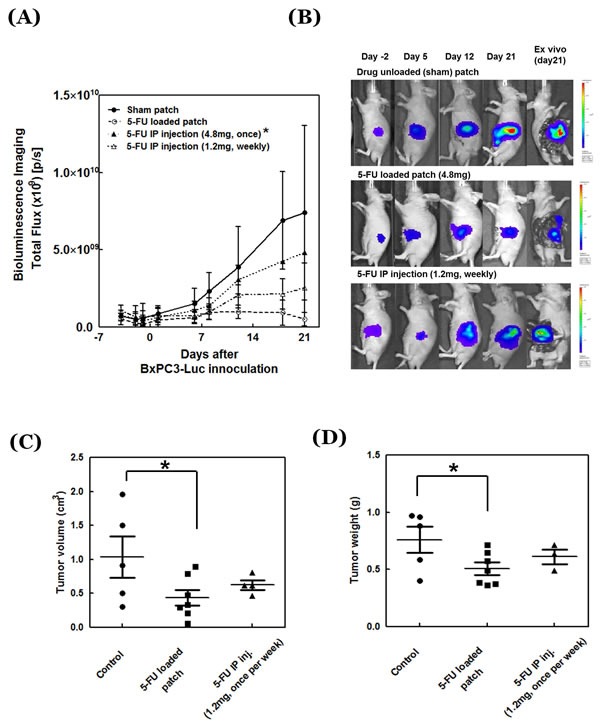
Figure 4. Antitumor efficacy of 5-FU-release patch.

A. Tumor growth curves of treated and untreated mice (n = 6). *The mouse number changed in the 5-FU i.p. injection group with high dose (4.8mg) due to mouse death (n = 6 at day -4, -2, -1, 1, 6, 8; n = 2 at day 12; and n = 1 at day 18, 21). B. Representative images of the treated and untreated tumors. C. Tumor weight and D. tumor volume at day 21 after drug treatment.
