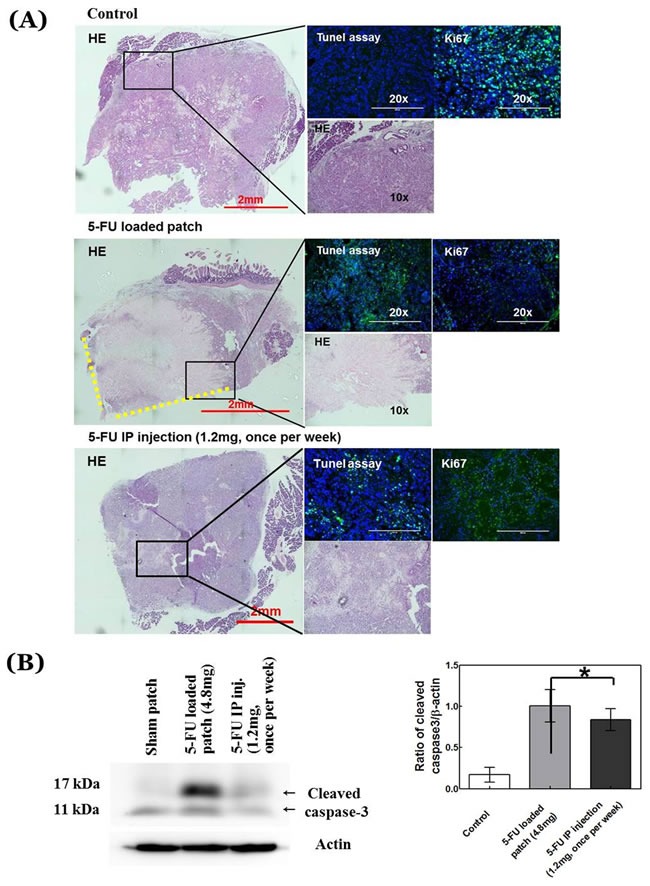
Figure 5. Histological analysis.

A. Images of hematoxylin and eosin (H&E)-stained pancreatic-cancer tissue sections from treated and untreated mice along with TUNEL and KI-67 staining for each condition. B. Cleaved caspase-3 from treated and untreated mice. H&E scale bar, 2 mm; fluorescence-image scale bar, 200 µm. Yellow-dotted line shows contact side of 5-FU-loaded patch.
