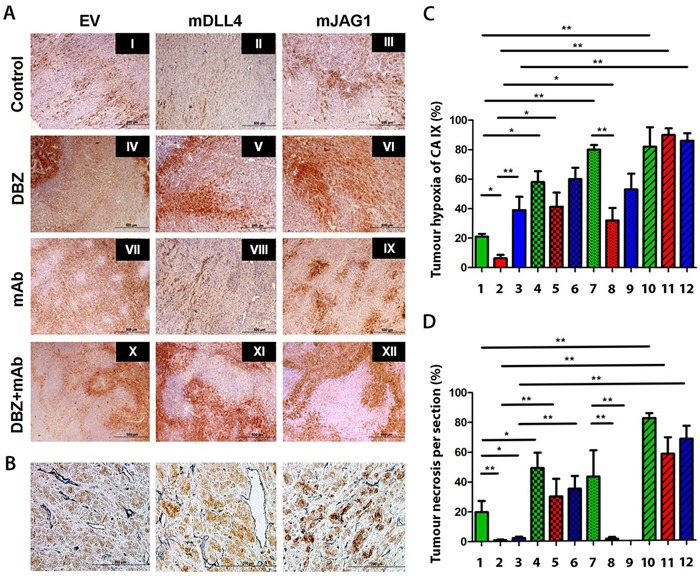
Figure 6. Immunohistochemical staining for hypoxia and tumour vessels in xenograft tumours.

A. Intra-tumour hypoxia staining of U87 tumour sections using carbonic anhydrase IX (CAIX) (brown). B. Double staining for CAIX (brown) and blood vessels (CD34) (blue) on tumour sections of U87. C. Tumour hypoxia quantification. ANOVA with Bonferroni's post-test. Each group contained 5 tumours. D. Tumour necrosis quantification. ANOVA with Bonferroni's post-test. Each group contained 5 tumours. *P<0.05, ** P<0.01. Each image in left panel or column in right panels represents: I/1, U87-EV control; II/2, U87-mDLL4 control; III/3, U87-mJAG1 control; IV/4, U87-EV DBZ; V/5, U87-mDLL4 DBZ; VI/6, U87-mJAG1 DBZ; VII/7, U87-EV mAb; VIII/8, U87-mDLL4 mAb; IX/9, U87-mJAG1 mAb; X/10, U87-EV DBZ+mAb; XI/11, U87-mDLL4 DBZ+mAb; XII/12, U87-mJAG1 DBZ+mAb.
