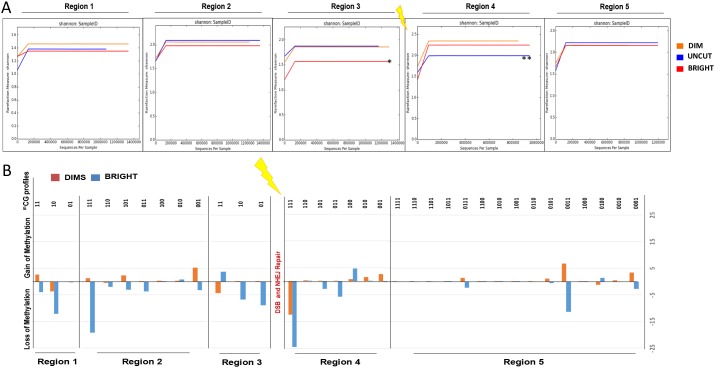
Figure 6. Regions adjacent to DSB give discriminate REC from UNCUT and BRIGHT from DIMS.
Epiallelesprofiles obtained from the analysis of the methylation of each amplicons were subjected to alpha and beta diversity (Qiime). (A) Shannon diversity index between BRIGHT, DIMS and UNCUT. In the X and Y axes are represented, respectively, “number of sequences for sample” and “Rarefaction measure (species richness)” for Shannon Index. (B) Gain or loss of methylation in BRIGHT and DIMS compared to the UNCUT.

