Figure 3.

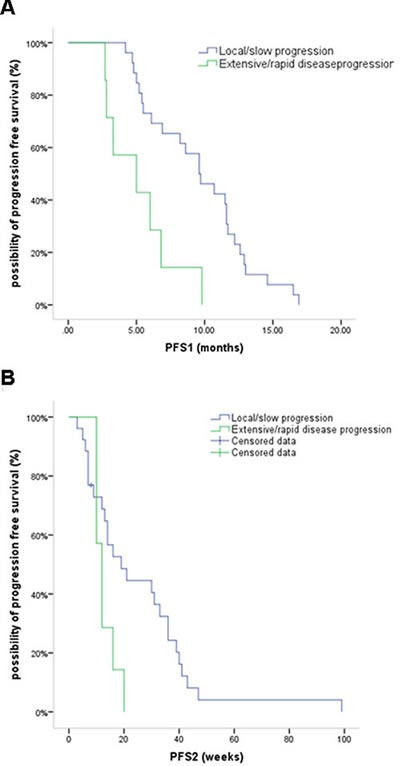
Kaplan-Meier curves for PFS1 (A) and PFS2 (B) in patients who had extensive/rapid disease progression versus those with local/slow progression.

Kaplan-Meier curves for PFS1 (A) and PFS2 (B) in patients who had extensive/rapid disease progression versus those with local/slow progression.