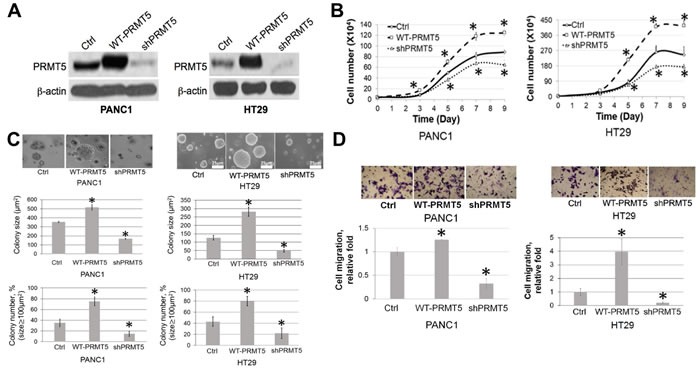
Figure 2. PRMT5 is important for cell proliferation, anchorage-independent growth and migration of PDAC and CRC.

A. Western blot, confirming stable PRMT5 overexpression and shPRMT5 knockdown in PANC1 and HT29 cells. B. Cell proliferation assay, showing that cell proliferation was significantly higher in the WT-PRMT5 cell lines, while shPRMT5 cells exhibited quite opposite effect in both PANC1 and HT29 cell lines. C. Anchorage-independent growth assay, showing that anchorage-independent growth was significantly higher in the WT-PRMT5 cell lines, while dramatically reduced in the shPRMT5 cells. Both colony size and number are quantified at the bottom of the corresponding panels. The data represent the means ± standard deviation (S.D.) for three independent experiments. *P < 0.05 vs. control (Ctrl) group. D. Cell migration assay, showing that cell migration was significantly higher in the WT-PRMT5 overexpression cells, while significantly reduced in the shPRMT5 cells. Upper panels, representative pictures in 20X magnification. Lower panel, quantification for the change in migration. The data represent the means ± S.D. for three independent experiments. *P < 0.05 vs. Ctrl.
