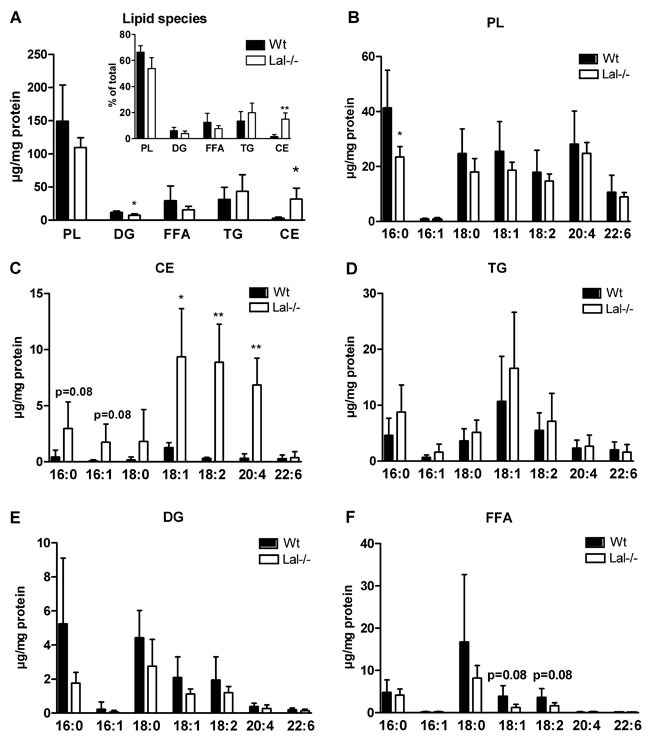
Figure 6. Accumulation of 18:1, 18:2, and 20:4 in CE fraction of Lal-/- macrophages.

A. GC analysis of lipid species in Wt and Lal-/- macrophages. Inset: Percentage distribution of lipid species. B.-F. GC analysis of FA composition in PL-, CE-, TG-, DG-, and FFA-corresponding bands after TLC separation. Data are shown as mean + SD (n = 5). *p < 0.05, **p ≤ 0.01.
