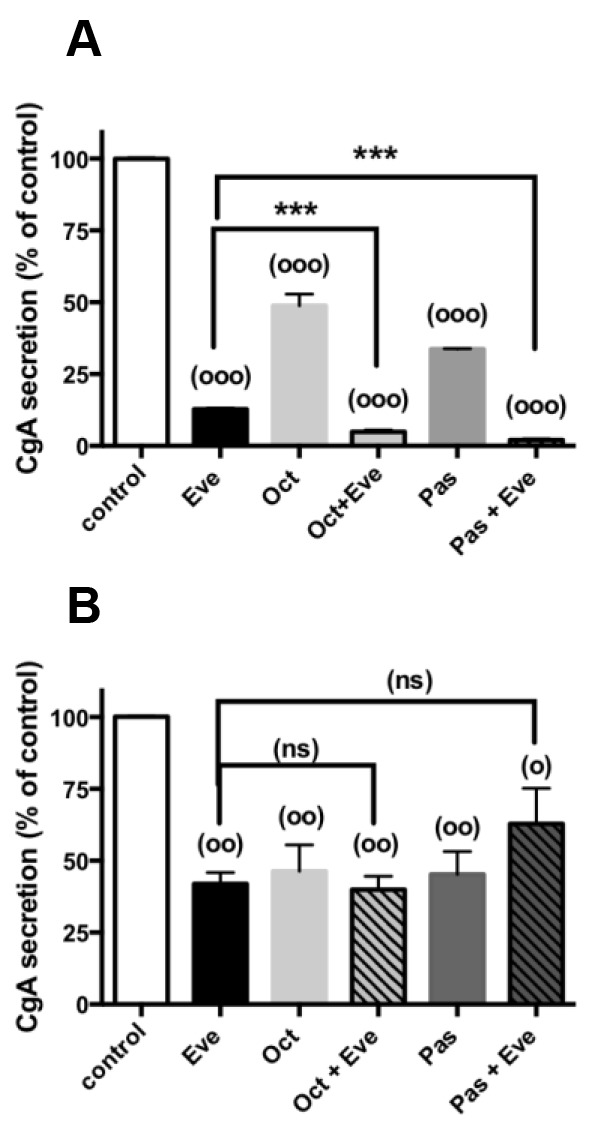
Figure 4. CgA secretion in combined treatments of everolimus with SSAs.

Primary culture cells from (A) one pNET (n°4), (B) 10 pNETs (n° 3,6-8,10,11,15-17,19) were incubated for 72h in the absence (vehicle) or in the presence of 1nM everolimus (Eve), or 1nM octreotide (Oct), or 1nM pasireotide (Pas) alone (diluted in vehicle) or in the presence of everolimus and octreotide or everolimus and pasireotide as indicated in the figure. CgA secretion was determined as described in patients and methods. Results are expressed as mean ± SEM ((A) n=1; (B) n=10) in percent of control. Each assay was performed in triplicate. (°) p<0.05; (°°) p<0.01 (°°°) p<0.001 versus control; (***) p<0.001, (ns) not significant.
