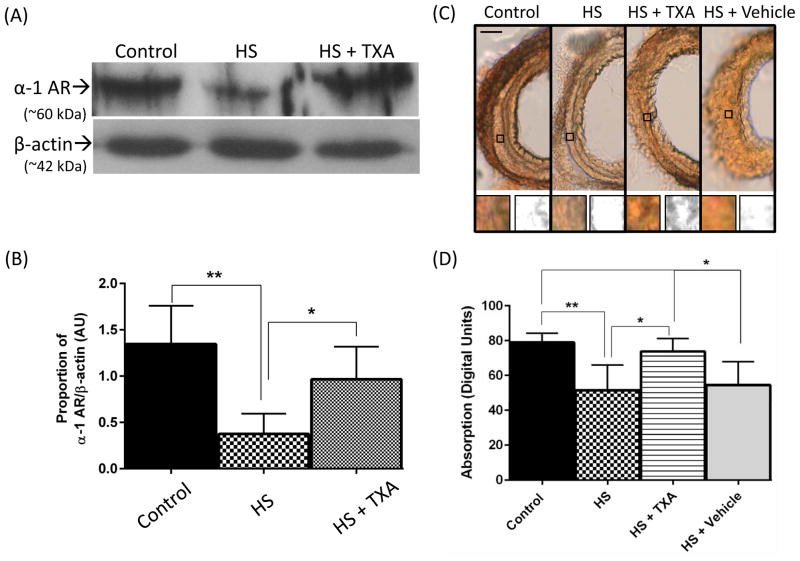
Figure 5.
(A) α1D renal artery band density by Western blot with representative α1D renal artery band (α-1 AR). The average of the control band densities was used as a reference. β-actin is shown as a loading control for the same animals. (B) Histogram of the average relative band intensities per group expressed as ratios of α1R/β-actin (n=6 animals/group). *p < 0.05, HS vs. HS + TXA; **p < 0.01, Control vs. HS. Results plotted as Mean ± SD. (C) Representative femoral artery sections labeled for α1D. Insets indicate sample smooth muscle regions of interest (squared boxes) both before and after 8-bit conversion. (D) Histogram of labeling density values in digital units. Scale bar is = 100 microns. **p < 0.01 Control vs. HS, *p<0.05 HS + TXA vs all other groups. Results plotted as Mean ± SD.

