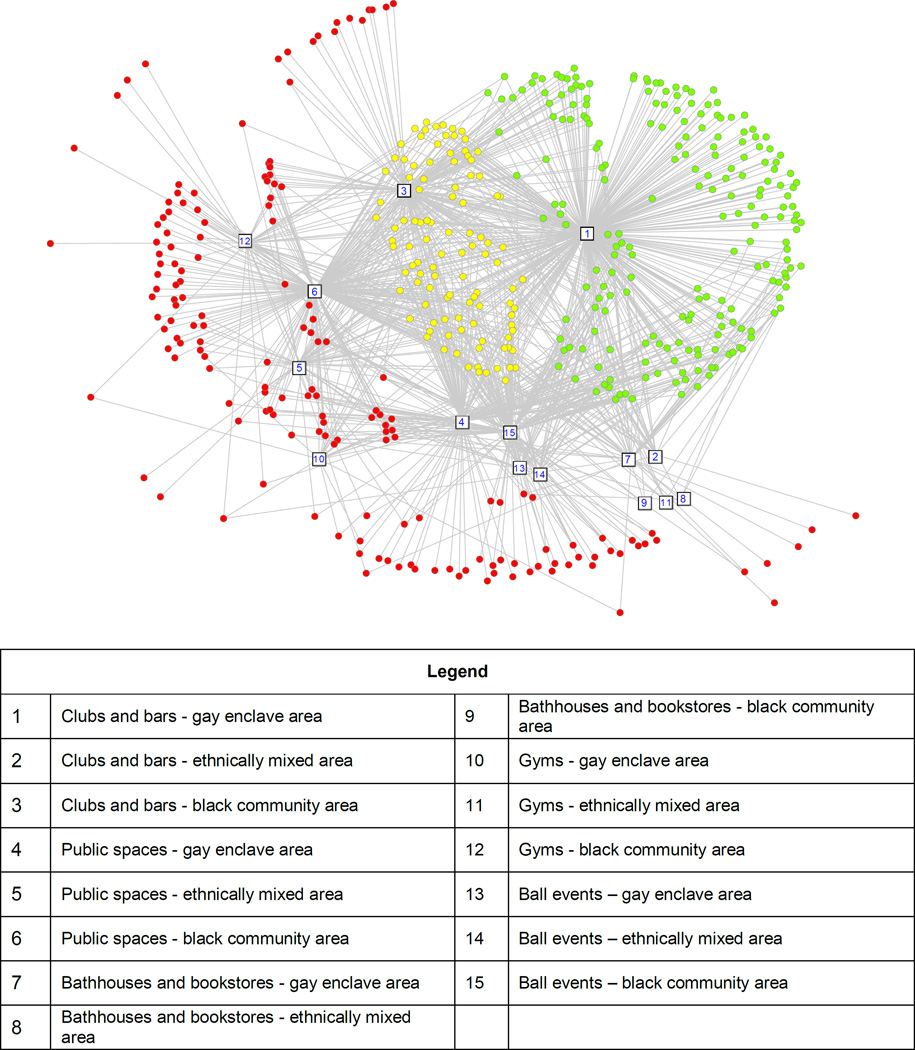
Figure 1.
Respondents (circles) shaded according to cluster membership in a two-mode network visualized using spring embedding layout in UCINET 6. Respondents with Gay Enclave cluster affiliations are green, with Bridges affiliations are yellow, and with Black Community affiliations are red. The venues to which individuals are tied are designated as numbered white squares, labeled below. Outsiders-- respondents without venue affiliations-- are not visualized.

