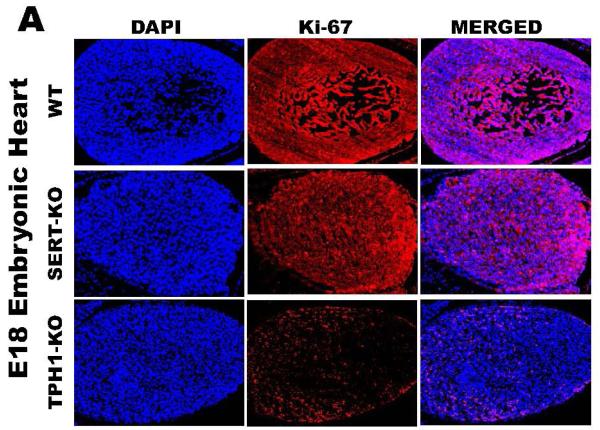
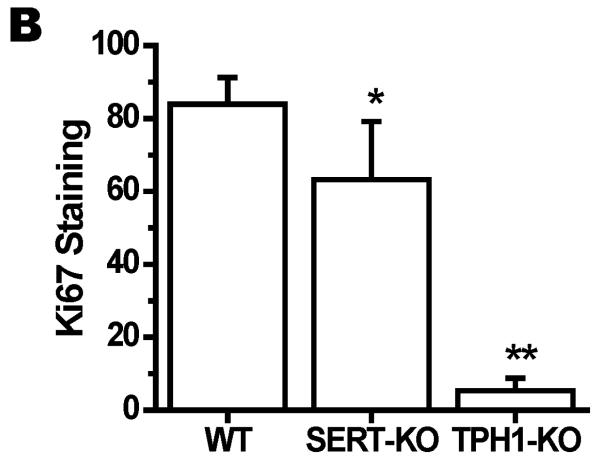
Figure 5. Ki67 staining of Embryonic heart from E.18 d WT and transgenic mice.
(A) The embryonic tissues were stained with Ki67, proliferation marker and DAPI to orient the staining in nucleus. Merged image show the level of staining in each tissue. The images in each panel are acquired at 400X magnification. The scale bars represent 10 μm. (B) Quantification of the proliferation marker Ki67 mean intensity. The proliferation rates in embryos of TPH1-KO were 16-fold lower than the rates of WT. This difference was much less pronounced in between the proliferation rates of embryos from SERT-KO and WT which was only 1.3-fold less in SERT-KO embryos. Asterisks indicate statistical difference between WT and SERT-KO or TPH1-KO mice (**) P<0.01 or (***) P<0.001 assessed by one way ANOVA and a Bonferroni post hoc test. All assays were performed on 10 slides per embryo, 6 embryos from each mouse, n=4.


