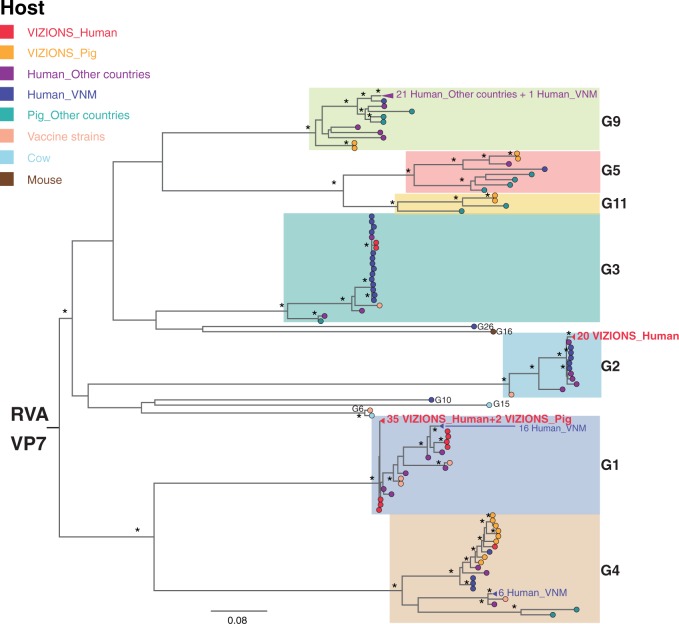
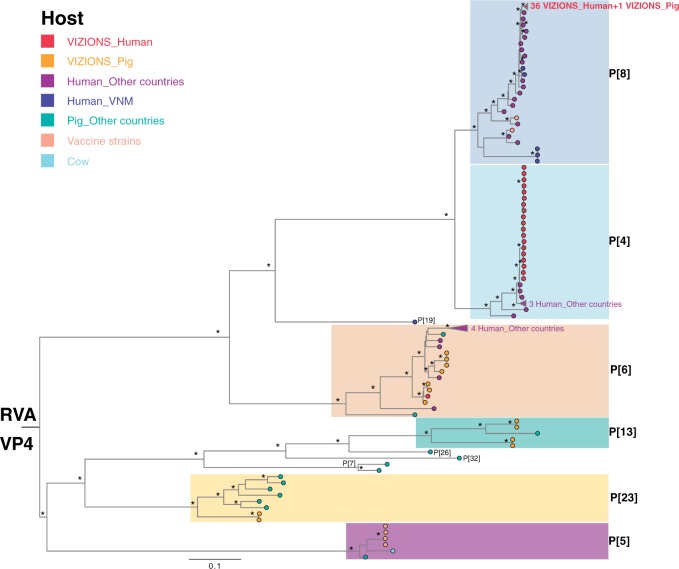
Figure 3.
ML phylogenetic trees inferred from the assembled nucleotide sequences for RVA VP7 and VP4 genes. (A) ML tree of VP7 gene showed genetic relationships between sequences from this study and additional sequences of corresponding segments from GenBank. Strains were coloured according to the host species from which the strain was identified, and “VIZIONS” in the annotation refers to strains identified from this study. Tree is mid-point rooted for the purpose of clarity and bootstrap values of ≥75 percent are shown as asterisks. All horizontal branch lengths are drawn to the scale of nucleotide substitutions per site. (B) ML tree of VP4 gene showed genetic relationships between sequences from this study and additional sequences of corresponding segments from GenBank. The pattern of tree visualization is consistent with VP7 tree, see description of Fig. 3A for more information.


