Figure 6.
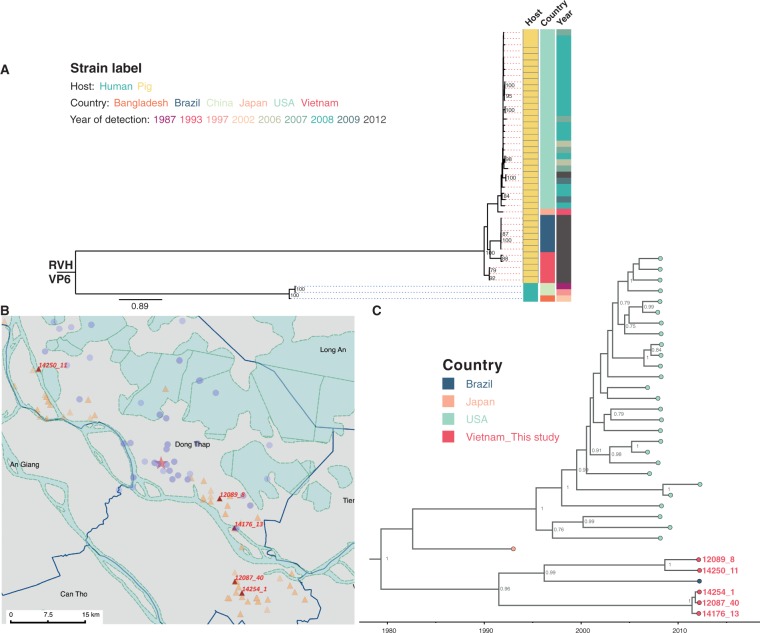
The analysis of RVH VP6 gene segment. (A) ML phylogenetic tree of RVH VP6 sequences. The RVH VP6 sequences in this study (N = 5) were compared with available full-length RVH VP6 sequences retrieved from GenBank (N = 39). Tree is mid-point rooted for the purpose of clarity and only bootstrap values of ≥ 75 percent are shown. All horizontal branch lengths are drawn to the scale of nucleotide substitutions per site in the tree. Strains were colour coded according to the host associated with the strain, the country where the strains were identified and the year of strain detection. (B) The geographical locations of pig farms that raised the pigs infected with RVH identified in this study. The farms were illustrated as red triangles with strain ID given, overlaid on the overall sampling area as shown in Supplementary Fig. S1. The red star indicates the Dong Thap Provincial Hospital. The map scale bar is shown in the units of geometric km. Refer to Supplementary Fig. S1 for more information on the background and provincial features colouring. (C) Time-resolved phylogenetic tree of porcine RVH VP6 sequences comparing local versus global sequences. Strains were coloured by the country where strains were identified. Porcine sequences identified from this study were highlighted in red, with strain ID given to link with geographical locations on map in panel B. Strains from Brazil were coloured in dark blue; orange indicates the Japanese porcine strain, and light green refers to the porcine strain from the USA. Posterior probabilities of internal nodes with values ≥0.75 are shown and the scale axis indicates time in year of strain identification.

