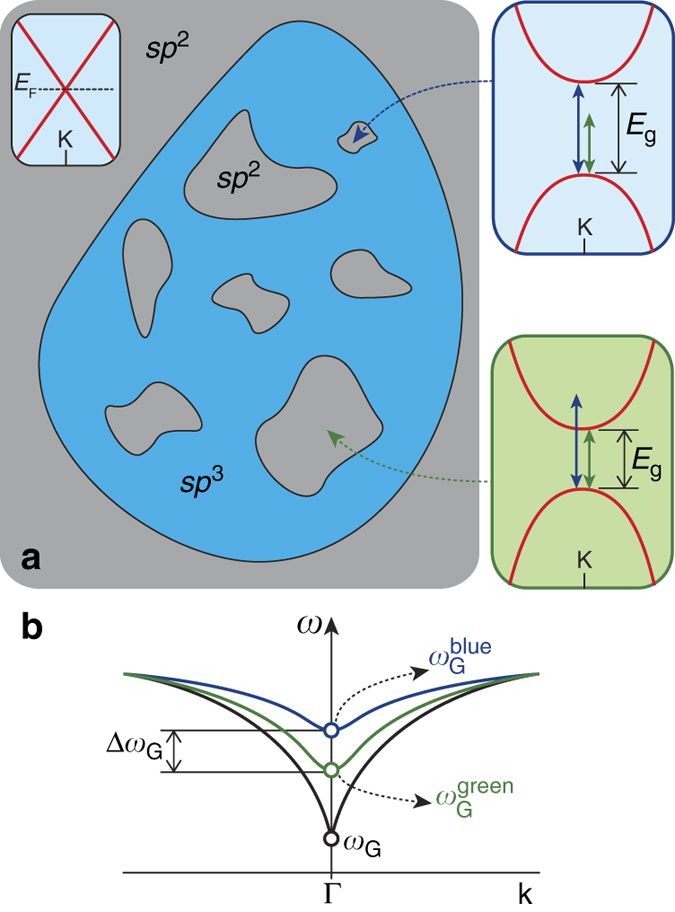
Fig. 3.

Mechanism for the G band dispersion with excitation laser energy. a Illustration of an sp 3 matrix (blue region) inserted in a graphitic (sp 2) system (gray region). The inset at the left side shows the linear energy dispersion of π electrons at the corner (K point) of the first Brillouin zone of pristine graphene. E F stands for the Fermi level, which occurs at the K point for undoped graphene. The quantum confinement of π electrons inside small sp 2 sites opens up band gaps of magnitude E g at the K point. The smaller/larger is, the wider/narrower the associated band gap becomes (larger/smaller E g), as illustrated in the top/bottom insets at the right side. The lengths of the green and blue arrows in these insets represent the photon energies of the blue (E L = 2.54 eV) and green (E L = 2.33 eV) excitation laser sources, respectively. An eventual match between E L and E g enhances the Raman scattered signal, and therefore smaller/larger sp 2 sites favor the Raman signal obtained with the blue/green laser source. b Double-degenerated TO/LO phonon dispersion near the center of the first Brillouin zone (Γ point). The black line is related to the unperturbed graphene lattice. The ω G is the value of the TO/LO branches at Γ, and the kink in the TO/LO dispersion is a Kohn anomaly. The presence of the band gap in the π electron dispersion near the K point weakens the screening effect that gives rise to the Kohn anomaly, which attenuates the softening in ω G. Since the band gap becomes wider as the sp 2 sites become smaller, the G band measured using the blue laser presents a higher frequency value than the G band frequency measured with the green laser, that is,
